How to calculate LOC (Lines of Code) coverage for C# application?
|
|
Lines of Code (LOC) coverage is a key metric in software development that measures the extent to which your test suite executes your codebase. In simple terms, LOC coverage refers to the proportion of code lines that are tested compared to the total lines in the system. Higher LOC coverage usually means that more parts of the application are being tested, increasing confidence in the software’s reliability.
When you develop and maintain C# applications, tracking LOC coverage can help you ensure that their tests are effectively verifying the functionality of the code.
In this article, we’ll cover everything you need to know about calculating LOC coverage in C# applications. We will also understand the different types of code coverage, set up a code coverage tool, and interpret the results.
What is Code Coverage?
Code coverage is a software testing metric that helps you determine the extent to which the source code of an application has been executed while running a test suite. It serves as a quantitative measure of the proportion of code that is being tested and can be expressed as a percentage.
In simple terms, code coverage answers the question: “How much of my code is covered by tests?” A higher percentage generally indicates more comprehensive testing, while a lower percentage implies that large sections of code have not been exercised by the tests.
Code Coverage Types
Before understanding the specifics of LOC coverage, it’s important to realize that there are different types of code coverage. Each of these types provides a unique insight into the testing of your application. The most common types of code coverage include:
- Statement Coverage: Measures the percentage of executable statements (lines of code) in your codebase that have been executed by your tests.
- Branch Coverage: Focuses on ensuring that each possible branch (e.g., the true and false conditions of an ‘if statement’) has been covered by the tests.
- Path Coverage: Ensures that all possible execution paths in the program have been tested, which is more exhaustive than branch coverage.
- Method Coverage: Measures the percentage of methods in the code that are invoked by tests.
- Class Coverage: Measures the percentage of classes in the code that tests have covered.
Why LOC Coverage Matters
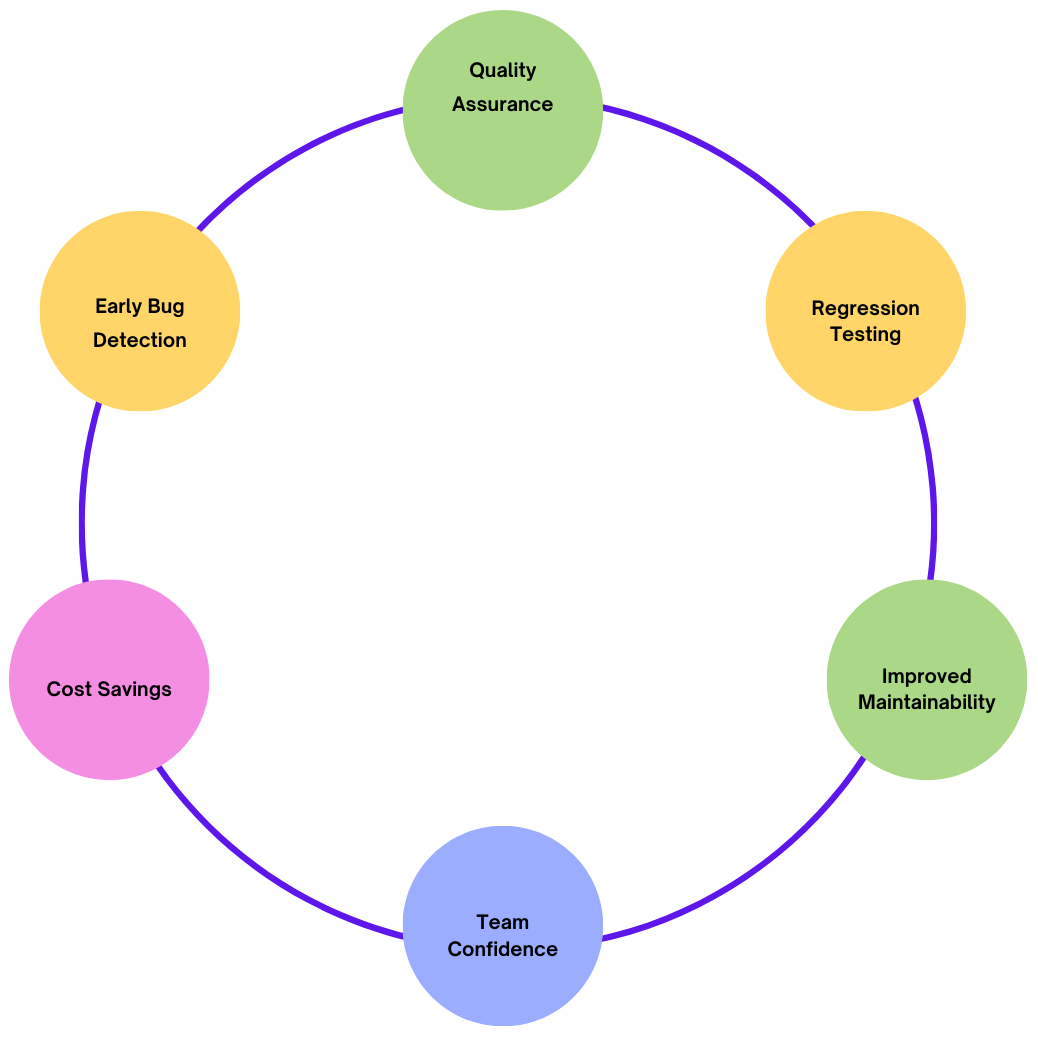
LOC coverage (Lines of Code coverage), also known as statement coverage, is a key metric that directly impacts the quality and reliability of a software application. It measures how much of the application’s source code is executed by your test suite, helping teams identify untested code and reduce the risk of bugs and defects. Here are several reasons why LOC coverage is important:
Quality Assurance
LOC coverage ensures that the majority of your code has been tested, which reduces the likelihood of untested portions harboring bugs. When a significant portion of your codebase is covered, you gain confidence in the stability and correctness of your application. Without sufficient test coverage, untested sections may contain hidden issues that could manifest as software defects in production.
Early Bug Detection
By striving for higher LOC coverage, you’re more likely to detect bugs earlier in the development process. This helps avoid costly fixes later in the software lifecycle, particularly when issues emerge during production. Since automated tests provide immediate feedback, well-covered code will expose issues before they escalate into larger problems. Read here the impact of late bug detection.
Regression Testing
When new features or changes are introduced to an application, there is always a risk of breaking existing functionality. High LOC coverage provides a safety net, allowing developers to detect regressions, i.e., issues introduced by recent code changes, early in the development process. Tests covering existing functionality help ensure that modifications haven’t inadvertently impacted the behavior of other parts of the codebase.
Improved Maintainability
Well-tested code tends to be more maintainable. LOC coverage encourages writing tests for new and legacy code alike, leading to a more reliable and stable codebase. This also provides long-term maintainability, as new developers joining the project can rely on a robust suite of tests to understand the code and make changes without introducing defects.
Team Confidence and Collaboration
High LOC coverage builds confidence among the development team. When developers know that their changes are thoroughly tested, they can focus on feature development and bug fixing without fear of introducing errors. This promotes a collaborative culture in which testing is seen as an integral part of the development process rather than an afterthought.
Cost Savings
Detecting bugs early in the development process through comprehensive LOC coverage can lead to significant cost savings. Fixing bugs in the later stages of development or worse, in production is far more expensive than addressing them during early development. By increasing LOC coverage and catching defects early, teams can reduce the cost of rework, support, and maintenance.
Common Misconceptions About Code Coverage
While code coverage is a valuable metric, it is important to avoid some common misconceptions:
- High Coverage Doesn’t Guarantee Quality: Even 100% code coverage doesn’t mean your software is bug-free. Coverage only tells you that the lines of code were executed, not that they were tested with meaningful or comprehensive inputs.
- Tests Can Be Superficial: It’s possible to achieve high coverage with superficial tests that don’t actually verify the correctness of the code. For example, a test may call a function but never assert that the output is correct.
- Focus on Meaningful Coverage: Achieving 100% coverage is often unnecessary and impractical. Instead, focus on testing the most critical parts of your application and writing meaningful tests that capture edge cases, boundary conditions and unexpected inputs.
- Coverage Is Not the Only Metric: Code coverage is only one of many metrics that can be used to measure software quality. Other metrics, like defect density, user satisfaction and performance, should also be considered in the overall evaluation of the software.
Now that we understand what LOC coverage is and why it’s important, let’s walk through how to calculate LOC coverage for a C# application.
Tools to Measure LOC Coverage in C# Applications
There are several tools available to help measure LOC coverage for C# applications. The most commonly used tools are:
- Visual Studio Code Coverage: This tool is built into Visual Studio Enterprise Edition and provides a straightforward way to measure LOC coverage by running unit tests.It integrates directly with built-in test frameworks like MSTest, NUnit and xUnit.
- OpenCover: It is a free and open-source tool for measuring code coverage in .NET and C# applications. It works well with unit testing frameworks like MSTest, NUnit and xUnit. It is a command-line-based but can be integrated with CI/CD pipelines to automate code coverage analysis.
- dotCover: It is a powerful commercial code coverage tool from JetBrains, the creators of ReSharper. It provides comprehensive code coverage analysis for .NET and C# applications, including LOC coverage. It seamlessly integrates with JetBrains Rider and Visual Studio, making it easy to use for developers already working with JetBrains tools
- Coverlet: A popular open-source code coverage framework for .NET Core and .NET Framework applications. It integrates with test runners like xUnit, NUnit and MSTest, making it highly flexible. Coverlet is commonly used with the .NET CLI and can be integrated into CI/CD pipelines. It supports a variety of output formats, including JSON, XML and Cobertura.
- SonarQube: A popular open-source platform for continuous code quality inspection, offering a comprehensive analysis of various metrics, including LOC coverage for C# applications. It supports the analysis of code coverage along with other key metrics such as bugs, security vulnerabilities and code smells. SonarQube integrates with various CI/CD tools such as Jenkins, Azure DevOps and GitHub Actions. It supports code coverage data from various testing tools, including those generated by OpenCover, Coverlet and Visual Studio.
Let’s break down the steps for calculating LOC coverage using these tools.
LOC Coverage with Visual Studio
If you’re using Visual Studio Enterprise, you can calculate LOC coverage as follows:
Step 1: Set Up Unit Tests
To begin, you need to write unit tests for your application. Unit tests are small, isolated tests that verify the functionality of individual components or functions in the code.
You can use frameworks like:
- xUnit: A widely used unit testing framework for C#.
- NUnit: Another popular unit testing framework for .NET.
- MSTest: Microsoft’s own testing framework, integrated into Visual Studio.
using Microsoft.VisualStudio.TestTools.UnitTesting;

namespace CalculatorTests
{
  [TestClass]
  public class CalculatorTests
  {
    [TestMethod]
    public void Add_ReturnsSumOfTwoNumbers()
    {
      var calculator = new Calculator();
      var result = calculator.Add(2, 3);
      Assert.AreEqual(5, result);
    }
  }
}
Step 2: Run Tests
After writing your tests, you can run them through the Test Explorer window in Visual Studio. This will execute all your unit tests and report whether they pass or fail.
Step 3: Collect Code Coverage Data
Once the tests are executed, you can collect code coverage data:
- Go to the Test menu in Visual Studio.
- Select Analyze Code Coverage and then choose All Tests.
Visual Studio will then run your tests and generate a detailed code coverage report.
Step 4: View the LOC Coverage Report
After running the tests, Visual Studio provides a detailed code coverage report that displays the percentage of code covered, including the number of lines tested versus the total lines of code.
- Blocks Covered: Represents the number of executable code blocks (typically lines of code) that were executed.
- Lines Covered: This metric refers to the number of lines of code that were executed by the tests. You’ll see the total number of lines and how many of them were executed during testing.
- Percentage Coverage: This percentage is calculated as:
LOC Coverage (%) = ( Lines Covered / Total Lines of Code ) x 100
LOC Coverage (%) = ( 750 / 1000 ) x 100 = 75%
Step 5: Interpret the Results
The report will display the percentage of code covered for each class, method and file. In addition, you can drill down into specific files and lines to see which parts of your codebase were not covered by the tests.
This granular information helps you identify which areas of the codebase need more testing.
LOC Coverage with OpenCover
If you’re not using Visual Studio Enterprise or prefer an open-source alternative, OpenCover is a great option for measuring LOC coverage.
Step 1: Install OpenCover
To get started with OpenCover, you can download it from the official repository or install it via NuGet. You’ll also need a unit testing framework like NUnit or MSTest to run your tests.
Step 2: Write and Run Tests
Ensure you’ve written your unit tests and have them ready for execution using your preferred test runner.
Step 3: Run OpenCover
OpenCover.Console.exe -target:"nunit3-console.exe" -targetargs:"path_to_tests.dll" -output:"coverage.xml"
This command generates a coverage report in XML format, which contains details about the number of lines covered.
Step 4: Generate the Coverage Report
After OpenCover generates the XML report, you can use reporting tools like ReportGenerator to convert the XML data into an HTML or other readable format.
ReportGenerator.exe -reports:coverage.xml -targetdir:"coverage-report"
The generated report will contain details about LOC coverage, similar to the Visual Studio coverage report.
LOC Coverage with Coverlet
Coverlet is another popular tool for calculating LOC coverage in .NET Core and .NET applications. It integrates well with xUnit, MSTest and NUnit, making it a versatile choice for C# developers.
Step 1: Install Coverlet
You can install Coverlet using the .NET CLI. To add Coverlet to your project, run the following command: dotnet add package coverlet.msbuild
Step 2: Run Tests with Coverage
dotnet test /p:CollectCoverage=true
This command will execute the unit tests and generate a coverage report in the console, which includes details about the lines of code covered.
Step 3: Generate Detailed Reports
dotnet test /p:CollectCoverage=true /p:CoverletOutputFormat=cobertura
The report will contain the same LOC coverage percentage as the other tools, allowing you to track which lines were covered and which were missed.
How to Increase LOC Coverage?
Improving code coverage is an ongoing process and achieving higher coverage requires disciplined testing and a focus on meaningful tests. Here are some strategies to improve your code coverage:
- Write More Unit Tests: Focus on writing unit tests for your application’s smallest testable units, such as individual functions and methods.
- Test Edge Cases: Don’t just test the “happy path” where everything works as expected. Write tests for edge cases, error conditions, and unexpected inputs.
- Use Mocking and Stubbing: For external dependencies such as databases, APIs, or services, use mocks and stubs to simulate their behavior in your tests. This allows you to isolate and test your code’s functionality without relying on external systems. Read more about mocks, stubs, and spies.
- Add Integration Tests: While unit tests are critical, it’s also important to have integration tests that ensure components work together correctly. These tests can improve coverage across the interactions between different parts of your application.
- Measure Coverage Regularly: Integrate code coverage tools into your continuous integration (CI) pipeline to automatically measure and report coverage whenever new code is added or modified. Here are some important CI best practices.
- Refactor Untestable Code: If certain parts of your code are difficult to test, consider refactoring them to make them more testable. This might involve breaking large functions into smaller, more focused functions or decoupling dependencies.
Conclusion
Code coverage is a crucial metric for understanding how much of your code is exercised by your tests. By analyzing different types of coverage, such as line coverage, branch coverage, and path coverage, you can gain deeper insights into the thoroughness of your testing efforts. Although high coverage does not guarantee bug-free code, it increases confidence that your tests are exercising critical parts of your application.
To get the most out of code coverage, focus on meaningful tests, track coverage over time, and continuously improve the quality of your test suite. By doing so, you’ll create more reliable software, reduce the risk of defects, and improve the overall quality of your application.
| Achieve More Than 90% Test Automation | |
| Step by Step Walkthroughs and Help | |
| 14 Day Free Trial, Cancel Anytime |