Metrics for CTO
|
|
“I think technology advanced faster than anticipated. In that whirlwind, a lot of companies didn’t survive. The reason we have done well is because, even in that whirlwind, we kept heads-down focused on the customers. All the metrics that we can track about customers have improved every year.” – Jeff Bezos
As a CTO, you face complex challenges daily. The spectrum of the job ranges from managing cybersecurity, system performance, QA, operational efficiency, and many more. One of the most effective ways to manage these responsibilities is through the use of well-defined metrics. These metrics provide the necessary insights to monitor performance and guide decision-making. You can easily align technology initiatives with business objectives through this information.
Right metrics help a CTO transform data into actionable intelligence, innovation, and a competitive edge in the marketplace. Let’s examine the most common metrics with examples and their needs in software development.
Development Productivity Metrics
Velocity (Sprint Points)
Through velocity you estimate the amount of work your team can complete during a sprint. This is usually measured in ‘story points’ which is a unit of measurement based on the complexity, time required to complete, and uncertainty of a user story. Velocity is a key metric used for planning and estimating the amount of work a team can manage in upcoming sprints.
Why do you require Velocity?
- Planning: It helps teams plan their workload for future sprints by providing a data-driven estimate of how much work they can complete.
- Predictability: By tracking velocity over time, you make more accurate predictions about project timelines and delivery dates.
- Improvement: Identify trends, such as increases or decreases in productivity, and take steps to address any issues.
- Stakeholder Communication: It is a clear and quantifiable metric that can be communicated to stakeholders to set expectations.
Velocity example
| Steps | |
|
|
Sprint 1:
|
Total for Sprint 1: 3 + 5 = 8 points |
Sprint 2:
|
Total for Sprint 2: 5 + 3 + 2 = 10 points |
Cycle Time
Time elapsed from starting work on a task to its completion. Velocity is a team-level metric that tracks project progress. Whereas cycle time measures the speed at which teams complete individual work items. It is usually measured in calendar days.
Why do you require Cycle Time?
- Efficiency Measurement: This helps measure the efficiency of the development process by tracking how long it takes to complete tasks.
- Bottleneck Identification: By analyzing cycle times, teams can identify and address bottlenecks or delays in their workflow.
- Predictability: Helps your team predict how long future tasks will take. This aids in more accurate planning and scheduling.
- Continuous Improvement: You can track improvements over time and make data-driven decisions to enhance productivity.
Cycle Time example
| Steps | |
|
|
|
Let us say a development team is working on a feature with the following timestamps:
Task A:
|
Then the Cycle Time is: 2 days, 6 hours. |
Code Churn
The amount of code that is added, modified, or deleted over a period. When engineers work on a new issue, churn will be higher. When they work on an easier issue, churn could be lower. Churn is also dependent on the stage of a project in the development lifecycle. Hence, as a CTO, you need to develop a sense of the patterns of churn level.
Why do you require Churn?
- Monitor Code Quality: High churn rates can signal potential issues with code quality. Which means the code may need frequent fixes or improvements.
- Project Stability: Monitoring churn helps you understand the stability of the project. Frequent changes might suggest instability. Whereas low churn might indicate more stable and mature code.
- Resource Allocation: You can allocate gteam members to areas needing more attention, such as code reviews or additional testing.
- Process Improvement: Identify inefficient processes where workflow adjustments are required to reduce unnecessary changes.
Code Churn example
| Steps | |
|
|
Week 1:
|
Total Churn for Week 1: 300 (added) + 150 (modified) + 50 (deleted) = 500 lines |
Deployment Frequency
How often is code deployed to production? This number reflects your team’s ability to deliver updates, new features, and fixes to users regularly.
Why do you require Deployment Frequency?
- Speed to Market: High deployment frequency allows teams to deliver new features and improvements to users quickly. This helps to stay competitive and responsive to market demands.
- Continuous Improvement: Frequent deployments encourage a culture of continuous integration and continuous delivery (CI/CD). This leads to more consistent and incremental improvements.
- Risk Reduction: Smaller, more frequent deployments reduce the risk associated with each release.
- Feedback Loops: Regular deployments enable faster feedback from users. Your team can iterate and improve the product based on real-world usage and needs.
Deployment Frequency example
| Steps | |
|
Let’s consider a development team tracking deployment frequency over a month:
|
|
To find the average deployment frequency per week:
|
|
| Here, the team is releasing updates to the production environment approximately three to four times each week. This high frequency can reflect a mature CI/CD process and a commitment to delivering value to users continuously and efficiently. |
Lead Time for Changes
It is the time taken between requesting a change, committing code, and deploying it in production. This metric is essential in Agile and DevOps environments as it reflects the efficiency and responsiveness of the development process.
Why do you require Lead Time?
- Efficiency Measurement: Lead time provides insights into how efficiently your team can move from concept to delivery.
- Bottleneck Identification: You can identify delays or bottlenecks in the development process and take steps to address them.
- Predictability: Short and consistent lead times improve the predictability of delivering new features and fixes. This helps to manage stakeholder expectations.
- Continuous Improvement: You can implement process improvements and measure their impact over time.
Lead Time for Changes example
| Steps | |
| Determine when the lead time starts (e.g., when a change request is submitted or a user story is created) and when it ends (e.g., when the change is deployed to production). | |
|
Let’s consider a development team tracking lead time for changes over a two-week period with the following changes:
Change 1:
|
|
|
So, the Lead Time: is 5 – 1 = 4 days.
Now, if there are 3 changes with different lead times, then the average can be calculated as:
|
|
System Performance Metrics
Uptime/Downtime
It measures the availability of systems and services. Downtime means periods when a system or application is not operational or available for use. Uptime is the opposite of downtime and is often measured as a percentage of total time.
Why do you require Uptime/Downtime?
- User Satisfaction: High uptime ensures that users have consistent access to the application.
- Business Continuity: High uptime is critical for business operations, especially for services that rely heavily on software systems.
- Competitive Advantage: Customers prefer reliable services that are consistently available.
- Compliance and SLAs: Maintaining high uptime is often required to meet SLAs and regulatory compliance standards.
Uptime/Downtime example
| Steps | |
| Suppose a system is monitored over a 30-day period (43,200 minutes). During this period, the system experiences the following downtimes:
|
|
|
Total Downtime: 120 (Scheduled Maintenance) + 60 (Unexpected Outages) = 180 minutes
Total Uptime: Total Time – Total Downtime = 43,200 – 180 = 43,020 minutes
Uptime Percentage: (Uptime / Total Time) * 100
= (43,020 / 43,200) * 100 ≈ 99.58%
|
Response Time
The time taken for a system to respond to a request. It is a critical performance metric that measures how quickly a system processes and returns results to the end-user.
Why do you require Response Time?
- User Experience: Faster response times enhance the user experience by making the application more responsive.
- Performance Monitoring: Tracking response time helps you in identifying performance bottlenecks and areas that require optimization.
- System Efficiency: Efficient systems have lower response times, indicating well-optimized and robust architecture.
- Business Impact: For businesses, response time can affect customer satisfaction and retention, impacting overall success and profitability.
- Compliance and SLAs: Many services have service level agreements (SLAs) that mention acceptable response times. You need to meet these requirements to maintain contracts and customer trust.
Response Time example
| Steps | |
|
Let’s consider a scenario where a user makes several requests to an application, and we record the response times:
|
|
|
To find the average response time for the requests:
|
Change Failure Rate
It is a metric in software development that measures the percentage of changes (such as deployments or releases) that result in failure and remediation, such as a rollback, hotfix, or patch.
Why do you require Change Failure Rate?
- Quality Assurance: A high change failure rate suggests issues with the development process, code quality, or testing practices.
- Continuous Improvement: Identify areas that need improvement to reduce failures and increase the stability of releases.
- Resource Allocation: You can allocate resources more effectively to areas like testing, code review, or process improvements.
- Customer Satisfaction: Low change failure rate leads to more reliable software, which enhances user satisfaction and trust.
- Operational Efficiency: Reducing the need for rollbacks and hotfixes saves time and resources. It allows teams to focus on new features and improvements.
Change Failure Rate example
| Steps | |
Let’s consider a development team that made several deployments over a month:
|
|
|
Change Failure Rate = (Failed Deployments / Total Deployments) * 100
= (5 / 40) * 100 = 12.5%
This indicates that 12.5% of all deployments in the given period resulted in a failure.
|
Throughput
It is the amount of work (tasks, features, bugs, transactions, etc.) completed in a given period (if calculated for a team) and delivered to the end users. If you are calculating it for system performance, then it can be the number of tasks, operations, or transactions that a system can process within a given period (throughout the project).
Why do you require Throughput?
- Performance Measurement: Clear indicator of the system’s performance under various loads.
- Capacity Planning: Helps in planning and scaling resources to meet user demands.
- User Experience: Fast and responsive interactions with the system.
- Optimization: You can identify bottlenecks and areas for improvement in the system.
- Business Impact: Supports more users or transactions and directly impacts the business’s ability to generate revenue and maintain customer satisfaction.
Throughput example
| Steps |
|
Throughput = Total Tasks Processed / Measurement Period
Suppose you have a development team of 6 people, and they completed a total of 36 features in 12 hours.
|
| The team’s throughput would be 36 features / 12 hours = 3 features/hour. |
Project Management Metrics
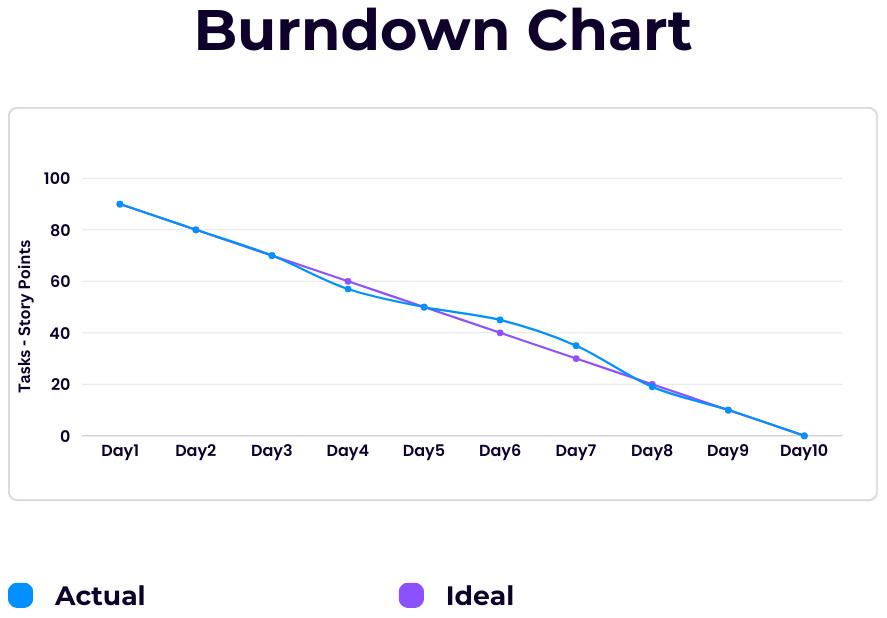
Burn Down Chart
Provides a visual representation of work completed versus work remaining in a sprint. A burn down chart is a graphical representation used in Agile and Scrum project management to track the progress of work over time. It shows the amount of work remaining (in terms of tasks, story points, or hours) against the timeline.
Why do you require Burn Down Chart?
- Progress Tracking: Helps teams and stakeholders see how much work remains and how quickly tasks are being completed.
- Transparency: Offers a clear, visual representation of the project’s status. Enhances the transparency and communication within the team.
- Forecasting: Allows you to predict whether they are on track to complete their work by the end of the sprint or project.
- Identifying Issues: Helps identify potential bottlenecks, scope creep, or other issues early for timely intervention.
- Motivation: Provides a visual incentive for the team. They can see their progress and the remaining workload decreasing over time.
A Burn Down Chart has:
- X-Axis (Time): Represents the timeline of the sprint or project, typically divided into days or weeks.
- Y-Axis (Work Remaining): Represents the amount of work remaining, which can be measured in story points, tasks, or hours.
- Ideal Line: A straight line from the top-left to the bottom-right of the chart, showing the ideal progression if work is completed at a consistent pace.
- Actual Work Line: A line showing the actual work remaining at the end of each day or week, plotted against the ideal line to show real progress.
Burn Down Chart example
- Total Work: 100 story points
- Sprint Duration: 10 days
- Day 1: 90 story points
- Day 2: 80 story points
- Day 3: 70 story points
- Day 4: 57 story points
- Day 5: 50 story points
- Day 6: 45 story points
- Day 7: 35 story points
- Day 8: 19 story points
- Day 9: 10 story points
- Day 10: 0 story points
- X-Axis: Days 1 to 10
- Y-Axis: Story points from 100 to 0
- Ideal Line: Draw a line from (Day 1, 90 story points) to (Day 10, 0 story points).
- Actual Work Line: Plot the daily remaining story points and connect them.
Budget Adherence
Tracking actual spending versus budgeted amounts. It is the extent to which a project remains within its allocated financial resources throughout its lifecycle.
Why do you require Budget Adherence?
- Financial Control: The project stays within financial limits, prevents overspending, and ensures efficient resource allocation.
- Stakeholder Confidence: Builds trust and confidence among stakeholders, including clients, investors, and management. Demonstrates financial discipline and effective management.
- Project Success: Projects that go over budget can face delays, scope reduction, or even cancellation.
- Risk Management: You can identify financial risks early and have timely interventions and adjustments.
- Performance Evaluation: It provides a metric to evaluate the performance of the project management team.
Budget Adherence example
| Steps | |
| Cost Variance (CV): Measures the difference between the budgeted cost of work performed (BCWP) and the actual cost of work performed (ACWP). |
|
| Cost Performance Index (CPI): Ratio of the budgeted cost of work performed to the actual cost of work performed. |
|
|
Let’s consider a project with the following data:
|
Cost Variance (CV) = BCWP – ACWP
= $60,000 – $70,000
= -$10,000
|
|
Cost Performance Index (CPI) = BCWP / ACWP
= $60,000 / $70,000 ≈ 0.86
|
|
|
Interpretation:
|
|
On-time Delivery
It is the percentage of projects or tasks delivered on or before the deadline. Refers to the completion and delivery of a project, product, or service by the agreed-upon deadline. It is a key performance indicator (KPI) that measures the punctuality and reliability of project execution and delivery.
Why do you require On-time Delivery?
- Customer Satisfaction: Customers receive their products or services as expected, which enhances satisfaction and trust.
- Reputation: On time delivery builds a positive reputation for reliability and efficiency.
- Resource Management: Helps manage resources effectively, prevents bottlenecks and over-allocation.
- Cost Control: Delays can lead to increased costs due to extended use of resources, penalties, or lost opportunities. On-time delivery helps in adhering to the budget.
- Competitive Advantage: Being reliable in delivering on time provides a competitive edge in the market.
On-time Delivery example
| Steps | |
|
Let’s consider a software development team tracking on-time delivery over a quarter:
|
|
|
On-Time Delivery Rate = (Number of On-Time Deliveries / Total Number of Deliveries) * 100
= (18 / 20) * 100 = 90%
|
Resource Allocation
It is the measure of the utilization of team members and other resources. It helps you assess and manage the distribution and utilization of resources such as time, personnel, equipment, and budget.
Why do you require Resource Allocation Metrics?
- Efficiency: They help identify how effectively resources are being used.
- Cost Management: Helps the project stay within budget by tracking resource expenditures.
- Performance Monitoring: Measures team productivity and identify areas for improvement.
- Risk Management: Detects potential resource shortages or overallocation early, allowing you for timely adjustments.
- Decision Making: Provides data-driven insights to make informed decisions about resource allocation and reallocation.
Resource Allocation examples
| Steps and Examples | ||
| Utilization Rate |
Definition: The percentage of a resource’s time that is actively spent on productive work.
Formula: (Time Spent on Productive Work/ Total Available Time) x 100
|
Example: If a developer works 30 hours productively out of a 40-hour work week.
Utilization Rate = (30/40) x 100 = 75%
|
| Resource Capacity |
Definition: The total amount of work that a resource can handle within a specific period.
Calculation: Sum of all available hours of all resources over the period.
|
Example: For a team of 5 developers, each with a 40-hour work week.
Total Resource Capacity = 5 x 40 = 200 hours per week
|
| Allocation Ratio |
Definition: The proportion of available resources allocated to a specific project or task.
Calculation: Allocation Ratio= (Allocated Resources/Total Available Resources)
|
Example: If 2 out of 5 developers are assigned to a project.
Allocation Ratio = 2 / 5 = 0.4, i.e. 40 %
|
Risk Management
They are the quantitative measures used to identify, assess, and monitor risks throughout the software development lifecycle. These metrics help you in managing potential issues that could negatively impact the project, such as delays, cost overruns, or quality problems.
Why do you require Risk Management Metrics?
- Early Detection: Allows for proactive management.
- Informed Decision Making: Provide data-driven insights to make informed decisions about risk mitigation strategies.
- Improved Planning: Helps you anticipate and prepare for potential challenges.
- Resource Allocation: You can allocate resources effectively to address high-priority risks.
- Stakeholder Confidence: Builds confidence among stakeholders by demonstrating a structured approach to managing risks.
- Project Success: Increase the likelihood of project success by minimizing the impact of risks on project objectives.
Risk Management Metrics examples
| Risk Definition | Calculation | Example |
| Risk Exposure: Measures the potential impact of a risk by combining its probability and impact. |
Risk Exposure=
Probability of Risk x Impact of Risk
|
If a risk has a 30% probability of occurring and the impact is estimated at $10,000.
Risk Exposure = 0.3 x 10,000= $3,000.
|
| Risk Severity: Categorizes risks based on their measures of damage or harm a hazard could create. | Typically represented in a risk matrix as (Negligible, Moderate, Minor, Major, Catastrophic). | A risk with high probability and high impact is classified as a high-severity risk, requiring immediate attention. |
| ARO (Annual Rate of Occurrence): The expected frequency of a threat occurring within a year. | ARO represents the anticipated number of occurrences of a risk event within a year. | If a particular risk may occur 3 times in a year, the ARO is 3. It is an important factor in calculating potential annual financial losses. |
| Schedule Variance: Measures the deviation in the project schedule caused by risk events. |
Schedule Variance (SV) = Earned Value (EV) – Planned Value (PV)
EV = (% completed work) x (Budget at Completion)
PV = (% scheduled work) x (Budget at Completion)
Note: Budget at Completion is an agreed-upon or approved total spending for the project.
|
Budgeted Cost of Work Scheduled= $1000.
If you have completed 65% of a $1,000 project, your EV is $650.
If you plan to complete 50% work with a $1,000 project by day 10, your PV is $500.
Schedule Variance (SV) = Earned Value (EV) – Planned Value (PV)
SV= $650-$500 = $50
Your project is ahead of schedule since the SV is positive.
|
QA Metrics
You need these metrics to produce high-quality products. These metrics help in tracking the effectiveness of QA activities, identifying areas for improvement, and making informed decisions to enhance software quality.
Why do you require QA Metrics?
- Quality Assurance: To check that the software meets the required quality standards and is free from defects.
- Performance Monitoring: Helps you track the effectiveness and efficiency of the QA processes and helps identify areas for improvement.
- Informed Decision Making: Provides data-driven insights for better decision-making regarding resource allocation, process changes, and project timelines.
- Risk Management: Identifies potential risks early in the development process and helps in mitigating them.
- Customer Satisfaction: Ensures that the final product meets customer expectations and requirements. It leads to higher satisfaction and loyalty.
- Continuous Improvement: Facilitates continuous improvement by providing feedback on the QA processes and highlighting areas for improvement. Here are Continuous Integration and Testing: Best Practices.
- Cost Management: Helps in identifying defects early in the development process. This reduces the cost of fixing defects later in the lifecycle. Read: The Impact of Late Bug Detection.
QA Metrics examples
| QA Metrics | Definition and Examples |
| Defect Density |
The number of defects identified in a software component or system divided by the size of the component or system. The formula to calculate is:
Defect Density= Total Number of Defects/ Size of System
Note: where Size of System is requirements, userstories, lines of code, etc.
Example: In 1000 lines of code, 50 defects were found then:
Defect Density = 50/1000=0.05 defects per 1000 lines of code
|
| Bug Fixes per Sprint |
It measures the number of bugs or defects that a development team resolves during a single sprint.
For example, for a particular sprint:
Total Bugs Identified: 30
Bugs Fixed During the Sprint: 25
|
| Incidents per Deployment Period | It measures the number of incidents or issues that occur in a specific period following a software deployment. |
| Test Coverage |
The most common definition of test coverage is a qualitative measure of how many features in your application are covered with tests. Read in detail about What is Test Coverage?
Test Coverage = The percentage of code or requirements covered by tests.
Example: If 900 out of 1,000 requirements (features) are tested, then: Test Coverage = (900/1000) x 100 =90% of features are covered by tests
|
| Defect Escape Rate |
Percentage of defects that were not identified and fixed during the initial testing phases but were discovered later in production or by end-users.
Formula = (Number of defects found in production/ Total number of defects) x 100
Example: If the number of defects found during testing (pre-production) is 150 and the number of defects found in production is 10, then:
Defect Escape Rate = (10/(150+10))x 100 = 6.25% of total defects were not identified before releasing to production.
|
| Mean Time to Detect (MTTD) |
Average time taken to detect an issue or defect from the moment it occurs. The formula is:
MTTD= Total detection time/ Total number of defects
Example:
MTTD= (30+45+60)/3=45 minutes
|
| Test Execution Time | Amount of time it takes to run a suite of tests, whether automated or manual, from start to finish. |
| Mean Time to Repair (MTTR) |
The average time taken to fix defects from the time they are detected. The formula is:
MTTR= Total Defect Repair Time/ Total Defects
Example: If the total repair time for 20 defects is 200 hours, then:
MTTR= 200/20=10 hours per defect
|
Here is the CTO’s checklist for QA.
Business Alignment Metrics
They ensure that the software development activities and outcomes are closely aligned with the strategic goals and objectives of the business.
Why do you require Business Alignment Metrics?
- Strategic Alignment: Checks that software projects and features support your company’s strategic goals.
- Value Delivery: Measures how effectively the development efforts contribute to business value and customer satisfaction.
- Resource Allocation: Helps prioritize projects and tasks that are most beneficial to the business.
- Performance Tracking: Monitors the impact of development activities on business performance and outcomes.
- Stakeholder Communication: Provides you with the insights and data to communicate with stakeholders about the alignment of IT and business goals.
Business Alignment Metrics examples
| Business Alignment Metrics | Definition and Examples |
| Customer Satisfaction (CSAT) | Calculated through surveys, Net Promoter Score (NPS), or feedback. In these surveys, customers rate their satisfaction on a scale (e.g., 1 to 5). |
| Return on Investment (ROI) |
Financial return on your technology investments.
ROI= (Net Profit from the Investment on the Project/ Total Investment) x 100
Example: If a software project generated a net profit of $200,000 and the total investment was $150,000, then:
ROI = (200000/150000)x100 = 133.333%
|
| Time to Market | Measures the time taken to deliver a software product or feature from concept to production. Which is the total time from project initiation to launch. |
| Customer Ticket Volume | Total number of support or service requests (tickets) that a customer service team receives over a specific period of time. These tickets can relate to a variety of issues, including product or service inquiries, technical support, complaints, and requests for information or assistance. |
| Compliance |
This means adhering to regulations such as GDPR, CCPA, ISO 27001, SOC 2, GDPR, HIPAA, or other relevant data protection laws. Compliance also includes adhering to change management processes and protocols, open source license requirements, incident response plans and protocols, etc.
Examples:
|
Security Metrics
Apart from these, there are a few security metrics that are very important for you as a CTO to consider:
- Incident Response Time: It is the time taken to detect and respond to security incidents.
- Vulnerability Management: Number and severity of vulnerabilities identified and fixed.
- Data Breaches: Frequency and impact of data breaches.
- Access Control: Effectiveness of user access policies and controls.
- Penetration Testing Results: Outcomes of periodic security testing.
Conclusion
As a Chief Technology Officer (CTO), you need metrics as an unavoidable tool. They help to decide the direction of an organization’s technology initiatives. They provide clear, quantifiable insights into various aspects of technology performance. Also, these metrics enable you to make informed decisions with confidence. They also allow for the identification of trends, potential challenges, and best utilization of resources.
Well-chosen and carefully monitored metrics are your greatest companions. They ensure that the technology infrastructure supports and directs the organization’s goals completely.
| Achieve More Than 90% Test Automation | |
| Step by Step Walkthroughs and Help | |
| 14 Day Free Trial, Cancel Anytime |