Metrics for VP of Engineering
|
|
Being a VP of Engineering can be challenging. You are to oversee the overall health and performance of the engineering department in your organization. To make sure that engineering delivers value to the organization, you need metrics that give you a quantifiable overview of what’s happening. As a VP, you will be taking stock of metrics that tell you about organizational health, the engineering team’s quality and performance, financial performance, strategic alignment, and product and market impact.
Here’s a list of different metrics that you, as a VP of engineering, can use. We will break them down into different categories to help you better understand them.
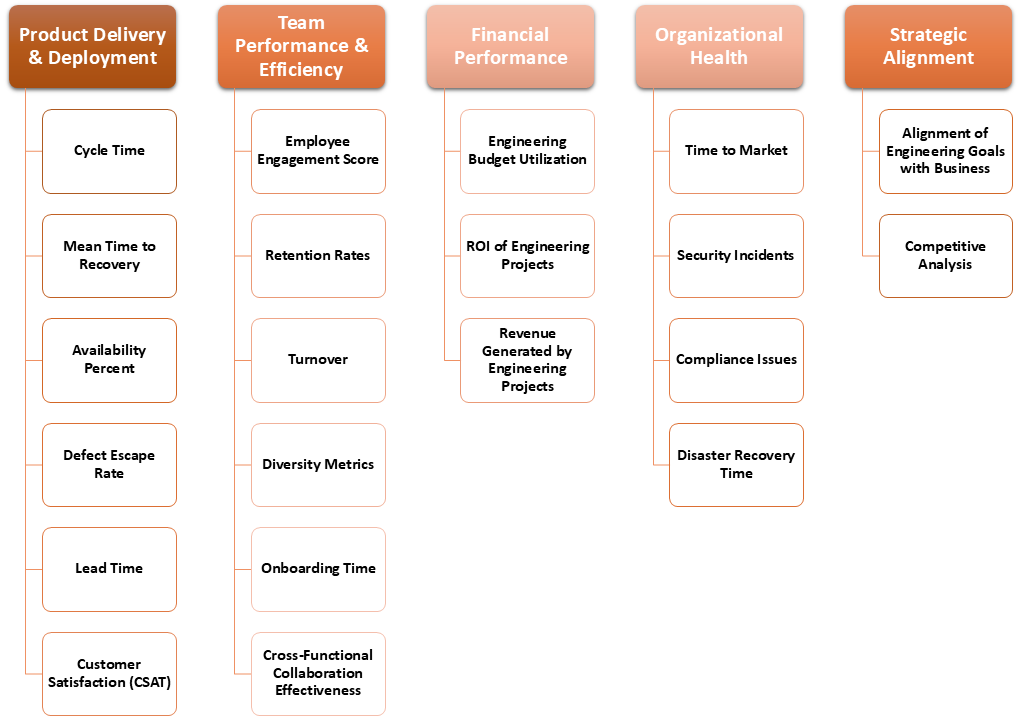
Metrics for product development and delivery
These metrics take into account the various aspects involved in the SDLC process. Though many of them might be too granular for a VP of Engineering to mull over, you can definitely benefit from a few. What you need to look at are metrics that talk about the development speed, efficiency, and quality. It will give you the upper hand in knowing what is going on within your department.
Cycle time
What is it? It is the amount of time it takes for a task or user story to move from “in progress” to “done.”
- In progress: Time spent actively working on the task.
- Review: Time spent in code review, testing, or other quality assurance processes.
- Deployment: Time taken to deploy the task to production, if applicable
What does this mean? Shorter cycle times tell that the team is efficient in delivering features, fixing bugs, or completing tasks. It often reflects a streamlined process with fewer bottlenecks. On the other hand, longer cycle times can mean potential inefficiencies or bottlenecks in the development process. This can include delays in code reviews, testing, or deployment. It may also indicate over-complexity or resource constraints.
If the cycle time is consistent, then it will be easier to forecast future work and set realistic delivery expectations. By analyzing cycle times, teams can identify bottlenecks in their process and take steps to improve efficiency.
From a VP’s perspective, cycle time is a good metric to measure the effectiveness of process changes such as the introduction of new tools or practices
Mean time to recovery (MTTR)
What is it? This is the average time taken to recover from a system failure or incident. It includes the time taken to diagnose, fix, and verify that the issue is resolved.
MTTR=(Total Downtime)/(Number of Incidents)
What does it mean? A lower MTTR tells that the team can resolve issues quickly, minimizing disruption. A higher MTTR, on the other hand, may suggest inefficiencies in the incident response process or a need for better tooling or resources.
This is a high-level metric that you can use to bring attention to areas that actually need investigation. You will have to dig deeper to know the actual cause and fix those. It also shows you how well the team can handle emergencies and restore normal operations, which is vital for maintaining customer trust and system reliability.
Ratio of opened to closed defects/bugs
What is it? Here, we are measuring the balance between the number of new defects or bugs reported and the number of defects or bugs that are resolved over a specific period.
This metric helps in understanding the quality of the codebase over time and how well the team is managing bug fixes relative to new issues. A consistently high ratio may indicate underlying quality or resource issues that need to be addressed.
Ratio = (Number of Open Defects)/(Number of Closed Defects)
What does it mean? A ratio greater than 1 tells that defects are being reported faster than they are being resolved which could signal a growing backlog or quality issues. A ratio of less than 1 suggests that the team is effectively managing or reducing the defect backlog. A ratio close to 1 indicates that defects are being reported and resolved at a similar rate, maintaining a steady state.
Availability percent
What is this? It is the amount of time that a system or service is operational and available to users. Availability is often expressed as a percentage of the total time that the system is expected to be operational (typically a year). It is directly tied to user experience and customer satisfaction as more downtime typically leads to more frustration and potential loss of revenue.
Availability=(Uptime/Total Time)*100
What does it mean? High availability (e.g., 99.9%) is generally desired and indicates that the system is reliable and has minimal downtime. Lower availability could indicate frequent outages or performance issues that need to be addressed.
Defect escape rate
What is it? It measures the percentage of defects that were not detected during the development and testing phases but were found after the software or product was released to production or to the end-users. In other words, it tracks the number of bugs that “escape” the quality assurance process.
Defect Escape Rate=(Number of defects found after release/Total number of defects)*100
Over here, the number of defects found after release refers to the bugs or issues that were identified post-release, either by users, customers, or during post-release testing. Total number of defects includes all defects found during both pre-release testing (e.g., during development, QA, etc.) and post-release.
What does it mean? A lower defect escape rate indicates that most defects are being caught during the development and testing phases, which means that the testing process is effective and thorough. It is a sign of a strong quality assurance process, leading to higher product quality and fewer customer-reported issues. This leads to a better user experience and higher customer satisfaction. Moreover identifying and fixing defects earlier in the development process is usually less costly than addressing them after release, making this metric critical for cost management.
On the other hand, a higher defect escape rate suggests that a significant number of defects are being missed during pre-release testing. This can tell you many things like inadequate test coverage, insufficient testing time, or ineffective testing processes.
You can use the defect escape rate to evaluate and improve testing strategies. If the rate is high, it might prompt a review of test coverage, test automation practices, or the effectiveness of different testing phases (e.g., unit testing, integration testing). This metric is also useful for identifying areas in the development process where quality assurance might be lacking, allowing for targeted improvements in those areas.
Lead time
What is it? It refers to the total time it takes from when a request is made until that request is fully delivered to production. The request could be a feature request, bug fix or user story.
- Request to start: The time it takes from when the request is made until work on the request begins. This can include prioritization, planning and resource allocation.
- In progress: The time taken to actually work on the request, including coding, testing and review.
- Deployment: The time from when the work is completed until it is deployed to production or delivered to the customer.
What does it mean? Shorter lead times show that the team is able to quickly move from request to delivery which is a sign of a well-optimized process with few bottlenecks. This means that customer requests or market demands are being met quickly which is crucial for maintaining customer satisfaction and competitiveness. With consistent lead times you can set realistic expectations with stakeholders and plan future work smoothly.
Longer lead times, on the other hand, suggest possible delays in the process. It could be due to lengthy planning, prioritization issues, resource constraints, or inefficiencies in the development process.
Customer satisfaction (CSAT)
What is it? This helps you gauge how satisfied customers are with a company’s products, services, or interactions. It’s usually measured by asking customers to rate their satisfaction on a scale, often from 1 to 5 with higher scores indicating greater satisfaction. CSAT provides direct feedback on what customers like or dislike. This gives actionable insights for improving products and services.
- Surveys: CSAT is typically measured through surveys that ask questions like, “How satisfied were you with your experience?” Customers respond on a scale (e.g., 1-5, where 1 is “very dissatisfied” and 5 is “very satisfied”).
- Touchpoints: Surveys are often conducted after key interactions, such as a purchase, support interaction, or product use, to measure satisfaction with that specific experience.
CSAT=(Sum of all satisfied customers/ Total number of customers)*100
What does it mean? Higher CSAT scores tell that a majority of your customers are satisfied with their experience. High satisfaction levels are closely linked to customer loyalty, repeated business, good brand reputation, and positive word-of-mouth referrals. A high CSAT score can also be a competitive differentiator which can help your company stand out in the market.
On the other hand, lower CSAT scores suggest areas where customer expectations are not being met. This highlights potential issues with the product, service or customer interactions that need to be addressed.
Businesses often benchmark CSAT against industry standards or competitors to understand their relative performance.
Net promoter score (NPS)
What is it? This is the measure of customer loyalty and the likelihood that customers will recommend a company’s products or services to others. NPS is based on a single survey question: “How likely are you to recommend our product/service to a friend or colleague?” Responses are given on a scale from 0 to 10.
- Promoters (9-10): Loyal customers who are highly likely to recommend the company.
- Passives (7-8): Satisfied but unenthusiastic customers who are vulnerable to competitive offerings.
- Detractors (0-6): Unhappy customers who are unlikely to recommend the company and may even discourage others from using it.
What does it mean? NPS is a leading indicator of customer loyalty and future business growth as promoters are more likely to make repeat purchases and refer new customers. It also tells you about the areas needing improvement as detractor feedback often points to specific issues that can be addressed to enhance customer satisfaction.
User adoption rate
What is it? This measures how quickly and effectively users are adopting and using a new product, feature or system after its launch. It reflects how well the product meets user needs and how successfully it has been integrated into their daily activities or workflows.
User Adoption Rate=(Number of new active users/Total number of targeted users)*100
- New active users: The number of users who have started using the product or feature within a specified time frame.
- Total targeted users: The total number of users who were expected or targeted to adopt the product or feature.
What it means? A high adoption rate tells that the product or feature is well-received and aligns with user needs. This suggests successful product design, marketing and onboarding efforts. For products that are monetized based on user engagement a high adoption rate is critical for driving revenue growth. Adoption is closely linked to user engagement, retention, and long-term product usage.
A low adoption rate suggests that users may be facing barriers to adoption, such as a steep learning curve, lack of perceived value, or insufficient training and support.
Metrics for team performance and efficiency
These set of metrics should help you assess your department’s productivity, employee satisfaction and retention, and team collaboration. A few of these aspects, like gauging your department’s productivity is going to be more of a general level check to see trends and patterns. Usually middle management like leads and managers take care of these aspects, like stories delivered, code coverage, technical debt, etc. in detail.
Employee engagement score
What is it? This is a measure of how emotionally committed and motivated employees are toward their work, their teams and the organization as a whole. Engaged employees are going to be more productive, innovative and contribute positively to the organization’s success.
- Surveys: Engagement is often measured through employee surveys that ask questions related to job satisfaction, alignment with company values, work-life balance, recognition, and career development. Employees typically rate their responses on a scale (e.g., 1-5 or 1-10).
- Pulse surveys: Short, frequent surveys that provide real-time insights into employee engagement.
What does it mean? This score is usually an average of the scores from various survey questions related to engagement. Some companies also use a weighted average where certain aspects of engagement are given more importance. These scores provide insights into the health of the company culture and help identify areas where improvements are needed.
Low engagement scores suggest disengagement, which could result in lower productivity, higher absenteeism and increased turnover. This low engagement might be due to factors like poor management, lack of recognition, unclear goals or inadequate growth opportunities.
Retention rate
What is it? It measures the percentage of employees who remain with the organization over a specific period. It is the opposite of turnover rate and can provide you insights into how well are you retaining your employees, particularly top talent.
What does it mean? High retention rates show that employees are satisfied with their work environment, compensation, opportunities for growth and company culture. This leads to a stable workforce. Retaining employees reduces the costs associated with recruiting, hiring and training new employees which all come out of the engineering budget.
Low retention rates suggest that employees are leaving the organization at a higher rate. This could be due to dissatisfaction, better opportunities elsewhere or issues within the company.
Retention rates are often analyzed by department, role or tenure to identify specific areas that may require attention. You can track retention rates to evaluate the effectiveness of your talent management strategies like compensation, benefits, career development programs and company culture.
Turnover rate
What is it? Turnover rate is a metric that measures the percentage of employees who leave the organization over a specific period, either voluntarily or involuntarily. It’s a key indicator of employee satisfaction and the overall health of the workforce. Tracking turnover helps organizations identify patterns, understand the reasons behind employee departures, and implement strategies to improve retention.
What it means? High turnover rate suggests potential issues within the organization, such as poor management, lack of career opportunities, inadequate compensation, or a negative work environment. It also proves costly due to the expenses associated with recruiting, onboarding, and training new employees, as well as the potential loss of institutional knowledge and productivity. Moreover, this can negatively affect the morale of remaining employees and may lead to a culture of uncertainty or dissatisfaction.
A low turnover rate indicates that employees are generally satisfied with their roles and the company, leading to longer tenures and a more stable workforce.
Collaboration tools usage
What is it? This refers to the frequency and effectiveness with which employees use digital tools and platforms such as Slack, Microsoft Teams, Zoom, or project management software like Asana or Jira to collaborate with their colleagues. This metric assesses how well these tools are integrated into daily work routines and how they contribute to productivity and communication.
What it means? Monitoring usage helps ensure that the company is getting a good return on investment (ROI) from its collaboration tools. High usage means that employees are effectively using collaboration tools to communicate, manage tasks, and work together.
Low usage on the other hand tells that employees may not be fully utilizing the available tools. This could be due to a lack of training, inadequate tool selection or cultural barriers to adoption.
This data can help you decide which tools to keep and which to replace.
Cross-functional collaboration effectiveness
What is it? This is the measure of how well different teams or departments within an organization work together to achieve common goals.
What it means? This is useful to gauge the quality of interactions, the efficiency of cross-functional projects and the overall success of collaboration between teams with different expertise or functions. Issues in collaboration could be due to challenges in communication, coordination or alignment between teams. These issues will lead to project delays, missed goals and reduced innovation.
You can use this metric to assess the effectiveness of inter-departmental initiatives and to identify areas where collaboration can be improved.
Onboarding time
What it is? The time a new employee, particularly in engineering or technical roles, takes to reach full productivity within the organization. This metric measures the time from when a new hire starts until they are fully integrated into the team and can work independently on tasks at a level of productivity comparable to established team members.
- Initial orientation: Time spent on formal orientation, training, and introduction to company culture and policies.
- Training and skill development: Time required for the new hire to learn the specific tools, technologies, processes, and systems used by the team.
- Mentorship and shadowing: Time spent working alongside more experienced team members to gain hands-on experience.
- Autonomous work: The time it takes for the new hire to begin working independently without needing significant guidance or supervision.
What it means? Shorter onboarding times speaks of an efficient onboarding process where new hires quickly acclimate and start contributing at full capacity. This can be a sign of good training programs, effective mentorship and clear documentation. It also reduces the time and resources spent on bringing a new hire up to speed, which is financially beneficial to the organization.
On the other hand, longer onboarding times may suggest that the onboarding process is lacking or that the new hire is facing challenges in adapting to the role. This could be due to complex systems, inadequate training or unclear expectations.
Diversity metrics
What is it? This looks at the representation of different demographic groups within the engineering department. This includes considerations of gender, ethnicity, age, disability status and other aspects of diversity. These metrics help assess the inclusiveness of the hiring process, team composition, and the overall work environment.
What it means? Diverse teams bring different perspectives and ideas which can lead to more innovative solutions and better problem-solving. Companies with strong diversity metrics often have better reputations and stronger employer brands. This is definitely a competitive advantage in the marketplace. You can use this to attract top talent from underrepresented groups to broaden the talent pool.
Metrics for financial performance
Just like every department, your department also runs on a budget. As a VP, it becomes your lookout to keep track of the expenses. These metrics let you get perspective into where all the money is going so that you can make informed decisions to generate revenue and keep the department cost-efficient.
Engineering budget utilization
What it is? This measures how effectively the allocated budget for the engineering department or specific engineering projects is being used. It compares the amount spent to the budgeted amount over a specified period.
What it means? A 100% utilization indicates that the budget is being used exactly as planned. If the utilization is below 100%, it means that the engineering team is spending less than the allocated budget. While this can be positive underutilization may also indicate that projects are delayed, resources are not being fully used or there’s a potential underinvestment in critical areas. But if the spending is over 100% then the engineering team is exceeding the budget. This could be due to project scope creep, unforeseen expenses or inefficiencies in resource management.
ROI of engineering projects
What it is? This is the measure of the profitability or value generated by an engineering project relative to its cost. It assesses whether the benefits of a project outweigh its expenses. This helps organizations determine the financial return on their engineering investments. ROI ensures that engineering efforts are aligned with broader business objectives and contribute positively to the company’s bottom line.
What it means? A positive ROI indicates that the project generated more value than it cost, which is a sign of a successful investment. However, a negative ROI indicates that the project cost more than the value it generated suggesting a poor investment or the need for reevaluation.
You can use this metric to evaluate the success of completed projects and to forecast the potential returns of proposed projects. It can also be used to prioritize projects ensuring that resources are allocated to initiatives that offer the highest returns.
Revenue generated by engineering initiatives
What it is? It measures the direct financial impact that engineering projects or activities have on the company’s revenue. This metric tracks how much revenue can be attributed to new products, features, optimizations, or improvements developed by the engineering team.
The calculation varies depending on the type of initiative but generally involves tracking the revenue generated by a specific product, feature, or improvement after its implementation and attributing it to the engineering effort. Tracking revenue generated by engineering initiatives helps course-correct the team to focus on projects that drive business value and meet customer needs.
What it means? A high revenue impact indicates that the engineering initiatives are significantly contributing to the company’s top line which validates the investment in those projects. On the other hand, a low revenue impact suggests that the engineering initiatives may not be effectively contributing to revenue. This could indicate a misalignment with market needs, poor execution or the need for better product-market fit.
Metrics for organizational health
As a VP of Engineering, you would also have to keep an understanding of how your department adds to the organization’s health. Two parameters that you need to gauge here – innovation and risk management.
Percentage of revenue from new products
What this is? This metric measures the proportion of a company’s total revenue that is generated from products that have been recently developed and launched. It reflects how successful the engineering and product development teams are at creating products that contribute to the company’s financial growth.
What it means? A higher percentage of revenue from new products reflects the company’s ability to innovate and adapt to market demands. This is crucial for long-term growth and competitiveness. It also helps assess the effectiveness of the company’s product lifecycle management.
VPs of Engineering can use this metric to gauge the impact of their team’s innovation efforts and to justify continued investment in new product development. It’s also used to set goals and priorities for the engineering team to keep focus on projects that drive revenue growth.
Time to market for new products
What it is? It measures the amount of time it takes for a product to move from the initial concept or idea stage to being available for sale in the market. This metric is critical in industries where speed can be a competitive advantage. Monitoring TTM helps identify areas where the product development process can be improved such as reducing delays in decision-making, streamlining workflows or improving cross-functional collaboration.
What it means? A shorter TTM indicates that the company is efficient in bringing new products to market. This is crucial in fast-paced industries where being first can allow the company to capture market share, respond to customer needs faster and capitalize on emerging trends. It often translates to quicker revenue generation and a better return on investment (ROI) for R&D efforts. On the other hand, a longer TTM suggests potential inefficiencies or bottlenecks in the development process.
You can use this metric to assess the efficiency of the product development lifecycle and to set targets for reducing time to market. It can also be used to evaluate the impact of process improvements or new tools and methodologies on the speed of product delivery.
Security incidents
What is it? Any event that compromises the confidentiality, integrity, or availability of information, systems or networks is a security incident. This metric tracks the number, type and severity of security incidents that occur within an organization over a specific period.
The metric can be tracked simply by counting the number of security incidents. It is often categorized by severity like minor, major, critical or type like data breaches, unauthorized access, malware attacks. Tracking security incidents is critical for risk management as it helps to identify and address vulnerabilities before they lead to major breaches or losses.
What it means? A low number of incidents indicates that the organization has robust security measures in place. This reduces the likelihood of breaches or other security issues. In fact, many industries require organizations to report and manage security incidents as part of regulatory compliance. Thus a lower number of incidents can indicate better compliance with industry standards. This also helps maintain customer trust particularly in industries where data security is paramount.
A high number of incidents on the other hand, suggests potential vulnerabilities in the organization’s security posture. Often this requires immediate attention to prevent significant damage.
You can use this to evaluate the effectiveness of security measures and to prioritize investments in security tools, training and processes. It can also used to track the impact of security initiatives and to report on security posture to the executive team and stakeholders.
Compliance issues
What it is? These are instances where the organization fails to adhere to legal, regulatory or industry-specific standards and requirements. This metric tracks the number and severity of compliance issues identified within a specific period. Many regulations are designed to ensure safety, fairness and ethical practices which are reinforced and lead to the integrity of operations.
Similar to security incidents, compliance issues can be tracked by counting the number of issues. They are often categorized by severity like minor, major, critical or type like data protection, environmental regulations, industry standards.
What it means? A low number of issues tells that the organization is effectively managing compliance. This reduces the risk of legal penalties, fines or reputational damage. In highly regulated industries where trust is critical maintaining a low number of issues is critical for the organization’s reputation. A high number of issues suggest potential gaps in compliance management that will need your attention.
Disaster recovery time
What is it? It measures the amount of time it takes for an organization to recover and restore critical systems, data, and operations after a disaster or major disruption. This metric is crucial for minimizing downtime and ensuring business continuity.
What it means? A shorter recovery time indicates that the organization has effective disaster recovery plans in place which allows rapid restoration of operations and minimal downtime. This is good for business continuity, particularly in industries where downtime can result in significant financial losses or customer impact. Quick recovery times help maintain customer trust especially in sectors where service availability is a key expectation, such as finance, healthcare, and technology.
On the other hand, a longer recovery time suggests potential weaknesses in disaster recovery planning or execution. This could result in prolonged downtime, lost revenue and damage to the organization’s reputation.
You can also use this metric to conduct post-incident reviews, identify areas for improvement and enhance disaster recovery and business continuity planning.
Metrics for strategic alignment
All your efforts will be in vain if your department does not align with what business is aiming to achieve. For this, you need to keep in mind the business impact.
Alignment of engineering goals with business objectives
What this is? This metric measures how well the goals and priorities of the engineering department align with the broader business objectives of the company. It helps ensure that the work the engineering team is doing directly supports the strategic goals of the organization. This may include goals such as increasing market share, improving customer satisfaction or driving innovation.
- Goal mapping: One approach is to map engineering goals directly to business objectives, ensuring that each engineering initiative can be tied to a specific business goal.
- Key results: Tracking Key Results (KRs) that tie into larger business goals, as part of an Objectives and Key Results (OKR) framework, can also help measure alignment.
- Stakeholder feedback: Gathering feedback from business leaders and stakeholders to assess their perception of how well engineering efforts are aligned with business needs.
What it means? Alignment between engineering goals and business objectives helps maximize the engineering team’s strategic impact and ensures that resources are invested in the most valuable projects.
Competitive analysis
What it is? It evaluates how the engineering team’s capabilities, products, and innovations compare to those of competitors.
- Benchmarking: Comparing key engineering metrics, such as product quality, time to market, and innovation rates, against those of competitors.
- Market share analysis: Tracking changes in market share that can be attributed to engineering-led products or innovations.
- Customer feedback: Gathering insights from customers on how the company’s products compare to competitors in terms of features, performance, and reliability.
- Technology trends: Analyzing how the company’s use of technology stacks up against industry trends and competitor strategies.
What it means? A strong competitive position indicates that the engineering team is effectively enabling the company to outperform competitors. This could be through superior products, faster innovation or better customer satisfaction. A weak competitive position suggests that the company may be falling behind competitors in key areas which could signal the need for strategic changes or increased investment in engineering.
This metric gives important information about where to focus engineering efforts, such as developing new features, improving product quality or adopting new technologies. By understanding how the company’s engineering efforts compare to competitors you can identify opportunities for innovation and differentiation.
Challenges involved with metrics
- Choosing the right metrics: It can be difficult to identify which metrics are most relevant and meaningful. A metric that works well in one context might be less useful in another, depending on the company’s goals, industry, and team structure. Focusing on the wrong metrics can lead to misaligned priorities, where the engineering team might optimize for certain outcomes that do not contribute meaningfully to overall business objectives.
- Balancing qualitative and quantitative metrics: While quantitative metrics are easier to measure and track, they may not capture the full picture of performance, such as team morale, innovation, or customer satisfaction.
- Aligning metrics with business objectives: Ensuring that engineering metrics align with broader business objectives is crucial, but it can be challenging to link engineering activities directly to business outcomes, especially in complex organizations. If metrics are not well-aligned, the engineering team might excel at meeting internal goals that do not translate into business success, leading to misallocated resources and missed opportunities.
- Incentivizing the wrong behavior: Metrics can sometimes drive unintended behavior if teams start focusing on hitting the metric itself rather than the underlying goal. For example, a focus on reducing time to market might lead to cutting corners in quality. Misaligned incentives can result in short-term gains at the expense of long-term success by sacrificing product quality or team morale to achieve a specific metric.
- Communicating and interpreting metrics: Metrics need to be communicated clearly to all stakeholders, including those who may not have a technical background. Misinterpretation of metrics can lead to incorrect conclusions and misguided decisions. Poor communication can result in a disconnect between the engineering team and other departments, leading to misaligned expectations and a lack of coordinated efforts across the organization.
Bottom line
There’s no one-size-fits-all approach when it comes to deciding what metrics to choose and what to infer from them. You will have to consider your organization’s requirements and keep updating this set of metrics. However, remember that following many metrics will not guarantee success. You can achieve success even with a select few. Use all this information to understand trends and patterns happening within your organization and department. This will help you make informed decisions.
You can read more about how a VP can perceive metrics over here.
Additional resources
- Top-25 VP of Engineering Interview Questions
- Why Project-Related Metrics Matter: A Guide to Results-Driven QA
- Essential QA Metrics to Improve Your Software Testing
| Achieve More Than 90% Test Automation | |
| Step by Step Walkthroughs and Help | |
| 14 Day Free Trial, Cancel Anytime |