Graphs Testing Using AI – How To Guide
|
|
Statistical diagrams like graphs are quite helpful tools to have. You might see them as parts of dashboards, financial applications, reporting platforms, or even healthcare applications. As helpful as these diagrams are to business, they are equally difficult to test. Why would you need to test them? You might be testing a workflow wherein you want to make sure that the graph is rendered and shows a downward trend. Or you might want to validate the accuracy of the rendered output.
While it is generally difficult to automate the testing of graphs, the process is becoming possible thanks to powerful AI-based testing tools like testRigor. Read on to understand the nuances involved when you include graphs as a part of your automated software testing process.
Graphs Testing Using Traditional Test Automation Tools
If you’ve ever done manual testing of data structures, then you know firsthand how challenging it can be. If you add visual diagram structures like graphs to the mix, the job gets even more complicated. And if it is complicated for a human to understand this, then imagine what a herculean task it is to make a traditional automation testing tool do it!
While traditional automation tools are fantastic for dealing with repetitive tasks, they lack the “brain” to do the heavy computing needed to test graphs. While you can write code to make the system do it, you’ll need to be an expert at coding. Despite that, most of these testing tools don’t offer such advanced features to help you.
Here are some of the major conundrums graphs put traditional test automation tools in.
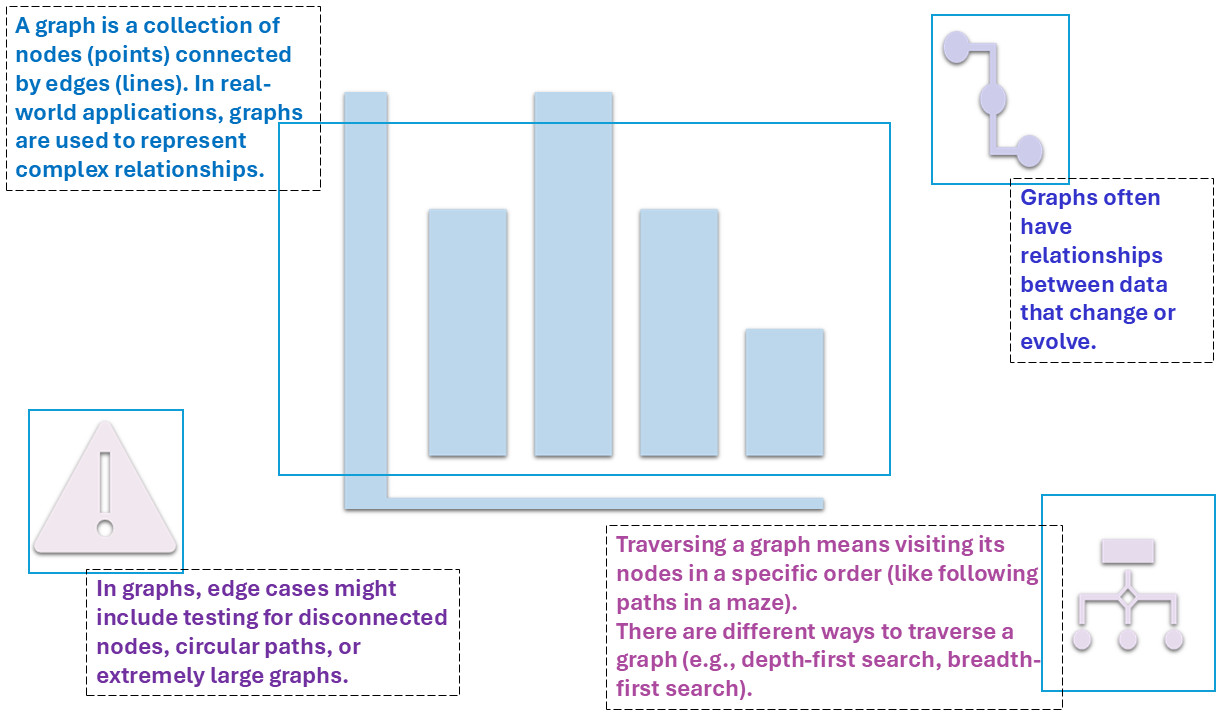
- Graph Complexity: Unlike simple lists or tables, graphs can have many interconnected parts. A graph could have hundreds or thousands of nodes, each linked to many others. This complexity makes it harder for traditional testing tools, which are usually designed for more straightforward structures like forms or databases, to understand and test every relationship and interaction properly.
- Visual Complexity: Graphs can vary significantly in format (bar charts, line graphs, pie charts, etc.) and complexity. If you’re testing them, you are required to analyze visual elements like data points, labels, axes, and colors. Moreover, if the graph supports user interactions like zooming in, then you need to check that, too.
- Graph Traversal: Traditional tools are often built for testing predefined sequences or expected inputs/outputs. However, with graphs, there are often many possible paths to follow, and some of these paths might only appear under specific conditions. Testing every possible path manually is impractical, and traditional tools struggle to dynamically explore all potential paths in a graph without human intervention.
- Dynamic and Complex Data Relationships: Traditional automated testing tools are typically static. They check predefined conditions, but they don’t automatically adapt to changes in relationships between data. For instance, a traditional test may check if two nodes are connected but won’t detect if new connections appear as the graph evolves, missing potential issues that only show up in changing or evolving graphs.
- Edge Cases and Path Coverage: Traditional testing tools are designed to handle more predictable and linear systems. They might fail to test edge cases properly in graphs, such as cases where nodes have no connections or when graphs become too large and complex to test manually. Additionally, since graphs can have countless unique edge cases, covering every possible scenario becomes much harder without a specialized tool.
- Difficulty in Predicting Outcomes: Traditional tools focus on simple input/output comparisons and aren’t designed to handle the cascading effects that might arise from modifying a node or edge in a graph. This unpredictability makes it harder to check that all scenarios are properly tested.
- Performance Issues with Large Graphs: Traditional tools are often optimized for smaller datasets. When faced with large-scale graphs, they might struggle to perform tests efficiently or quickly. They may also run into memory or processing limitations, leading to slow testing or incomplete test coverage.
- Lack of Intelligent Test Case Generation: Traditional testing tools typically rely on predefined test cases. They lack the intelligence to dynamically generate meaningful test cases based on the graph structure, especially when the graph is large or constantly evolving.
- Challenges in Detecting Graph Anomalies: Traditional tools are good at checking if something works according to plan but are not as effective at spotting subtle problems like anomalies in the graph’s structure or logic. For instance, a graph might have a loop (a cycle) where a node leads back to itself, causing problems in certain algorithms. Traditional tools may not automatically detect these issues unless explicitly programmed to check for them.
How AI Enhances Graphs Testing
Specialized tools that make use of AI can make testing graphs easier. These tools use different AI techniques to make logical and visual testing of graphs possible. Here’s how they can help:
- Automated Test Case Generation: AI algorithms can analyze the graph’s structure and automatically create test cases that cover a variety of paths, node connections, and edge cases. For example, AI can ensure that every node is tested for its relationship with other nodes and that all paths are explored. It even accounts for edge cases that are hard to predict.
- Graph Traversal Optimization: AI, particularly Reinforcement Learning (RL), can be used to find the most efficient ways to traverse a graph. This ensures that all key paths are tested while avoiding unnecessary repetition. It learns from previous tests and can adapt to focus on areas that might be problematic.
- Anomaly Detection: Machine learning (ML) algorithms can be trained to detect unusual patterns or structural issues within the graph. These algorithms learn from previous data and can identify when something is wrong, even if it’s not immediately obvious (e.g., a node that shouldn’t be connected to another).
- Predictive Testing: AI can use predictive analytics to anticipate where issues might arise in a graph based on patterns from previous tests or known vulnerabilities. For example, it might predict that certain nodes are more likely to become disconnected based on past tests.
- Automatic UI Testing of Graph Visualizations: AI-powered computer vision can automatically analyze screenshots or UI elements that display graphs to ensure they are correctly rendered. For example, AI can compare the visual representation of a graph with the expected output to ensure that nodes are connected properly and that there are no misaligned edges.
- Real-Time Graph Rendering Validation: AI can continuously monitor and verify the real-time rendering of the graph. If the graph doesn’t update correctly (e.g., a node doesn’t appear when it should), AI can detect the discrepancy immediately and flag it for review.
- Interaction and Usability Testing: AI can simulate user interactions with the graph, like clicking on nodes or dragging to zoom, and check if the graph responds correctly. AI can also assess whether the graph is visually accessible (e.g., clear labels, correct colors, or legible text). Read: Automating Usability Testing: Approaches and Tools.
- Visual Regression Testing: AI can automatically compare current screenshots of the graph with previous ones and highlight any visual differences. This ensures that new updates haven’t affected the graph’s presentation. It can even identify subtle changes that might affect the user experience. Read more: Visual Regression Testing.
Automating Graph Testing Using AI
When it comes to automated graph testing, while no tool is as good as the human eye, there is one that does a good job of assisting humans. testRigor is a great relief, thanks to its generative AI-powered approach to automated testing. This tool emulates a human tester, meaning it tries its best to look at test cases as a human would. This means plain English test steps and no complex XPaths or CSS to identify UI elements on the screen. Here’s how this powerful tool can bring a sigh of relief to your graph testing endeavors.
- Test Creation in Natural Language: We discussed how tough it can be to validate graphs as a human, let alone explain to a machine. Luckily, this tool lets you use plain English language to write test cases. Just write what you see on the screen, and testRigor will take care of the rest. Along with manually writing test cases in English, you can use the generative AI feature to help you create test cases in bulk based off a comprehensive description or prompt. Read: All-Inclusive Guide to Test Case Creation in testRigor.
- AI Vision: testRigor utilizes AI vision capabilities to “see” and interpret the visual elements of graphs. This allows it to go beyond basic pixel comparisons. It can help you to verify and analyze graph types (bar, line, pie, etc.), axes and labels, data point trends, color patterns, and more. Read: Vision AI and how testRigor uses it.
- Self-healing of Tests: testRigor constantly tries to make sure that your test runs are not flakey and that you’re only bothered if there’s a real issue. The tool uses AI to heal tests in the event of basic UI changes, such as if the UI element’s label or position changes. This is a huge relief from a test maintenance standpoint. Read: AI-Based Self-Healing for Test Automation.
- Visual Regression Testing: You can use testRigor to perform visual regression testing by comparing the application with a baseline. This can come in handy, too, if your graph data is meant to be static. Read: How to do visual testing using testRigor?
- Contextual Understanding: testRigor has another interesting capability – to allow testers to provide AI context at each step. Just by appending the “using ai” suffix to the command, you can easily test otherwise difficult scenarios. This is immensely helpful in graph testing as the AI is designed to understand the context of the graph within the application. This helps it to:
- Verify that the graph is displaying the correct data.
- Test that the graph’s appearance is consistent with expectations.
Let’s take a look at an example of how testRigor helps test graphs.
Testing Graphs Using testRigor’s AI
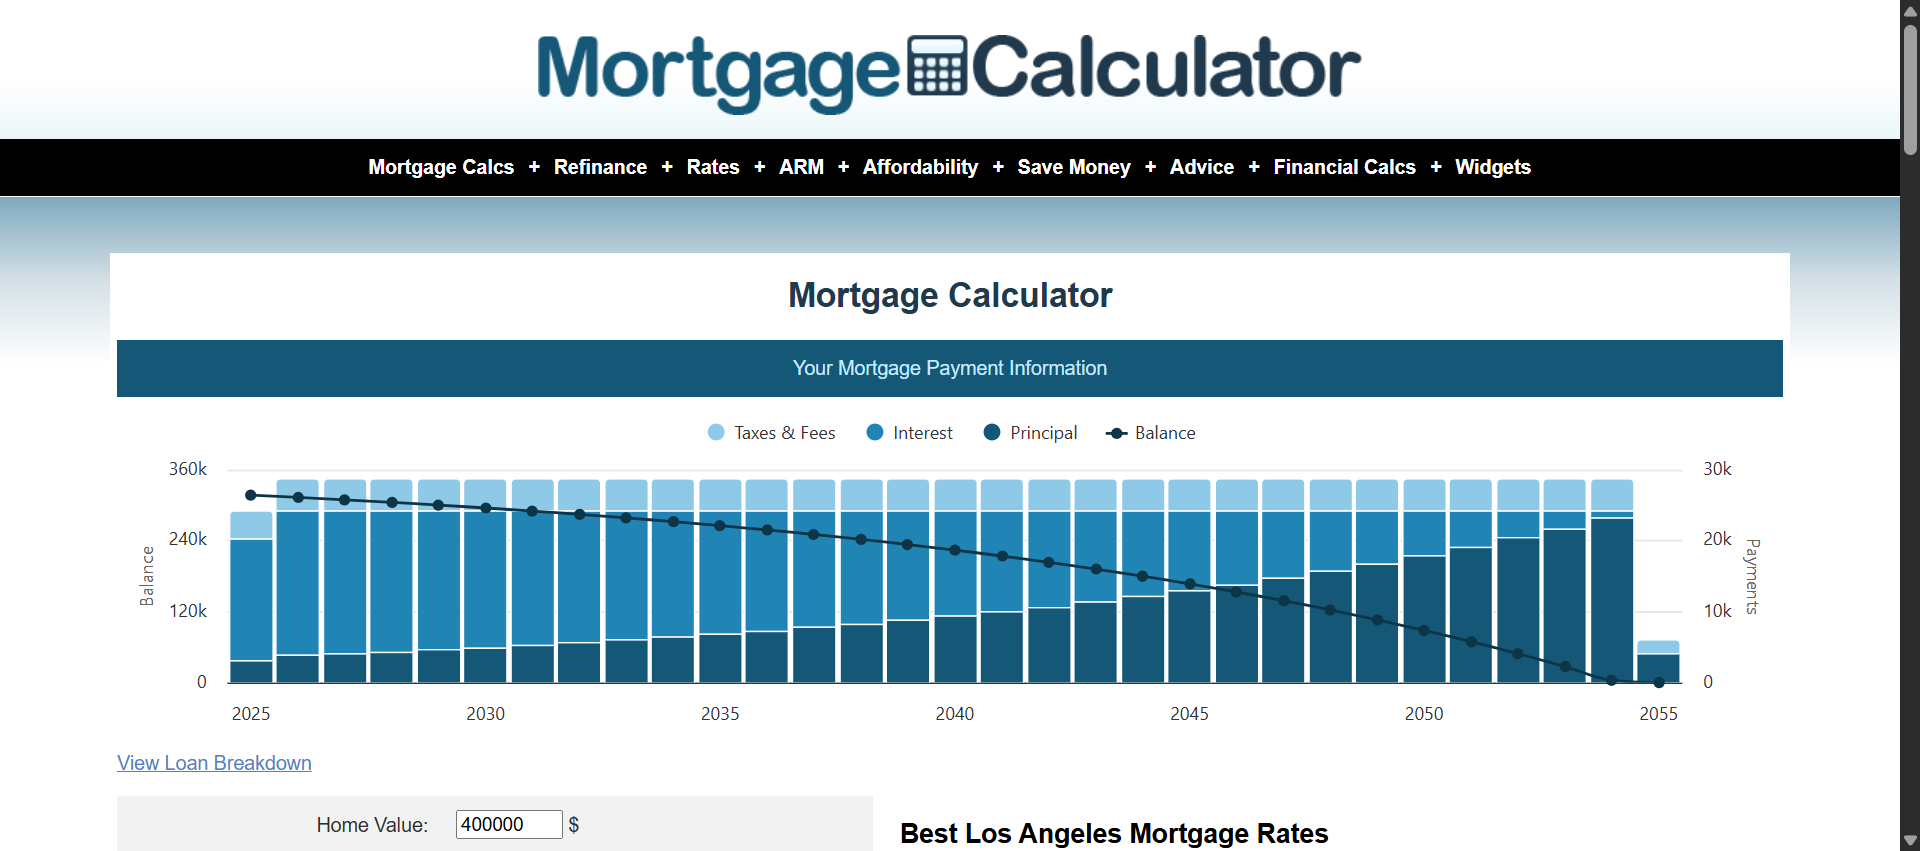
In the following example, we will consider a website that displays a graph for a mortgage calculator.
Let’s write a test case in testRigor that does the following:
- Validates the downward trend of the graph with time
- Checks the “Tax and Fees” value for the year 2030 as seen in the graph
- Checks that we are seeing a graph (not a pie chart)
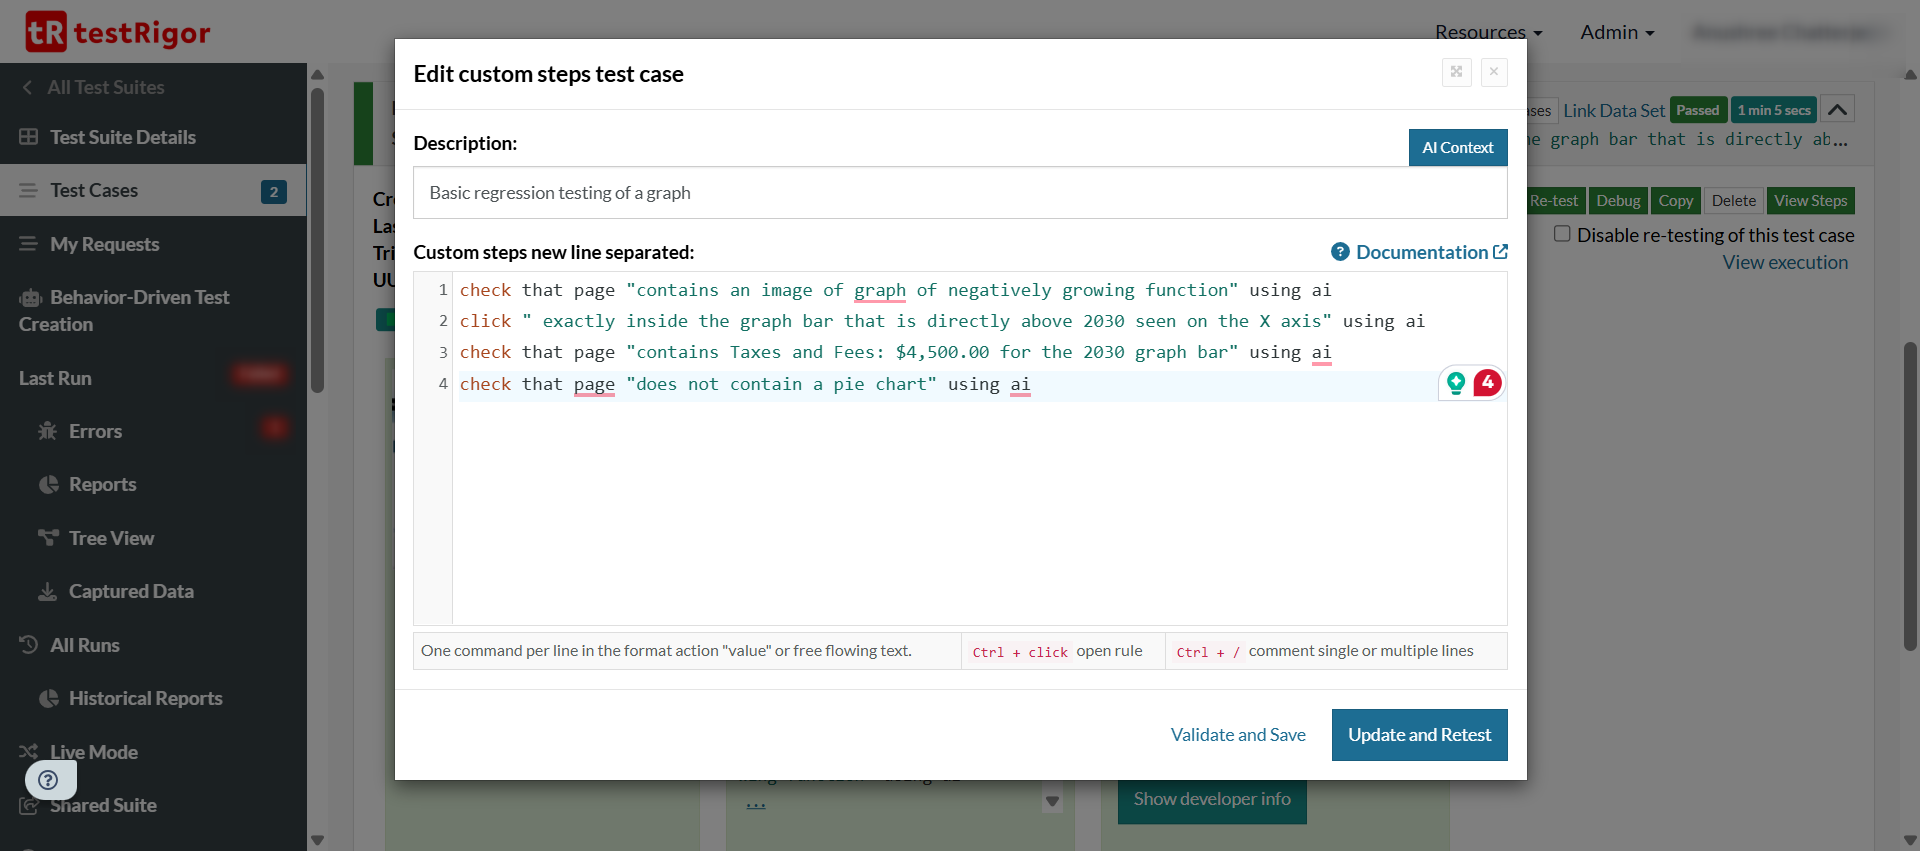
Here’s how easily you can write this test case in testRigor.
check that page “contains an image of graph of negatively growing function” using ai
click “exactly inside the graph bar that is directly above 2030 seen on the X axis” using ai
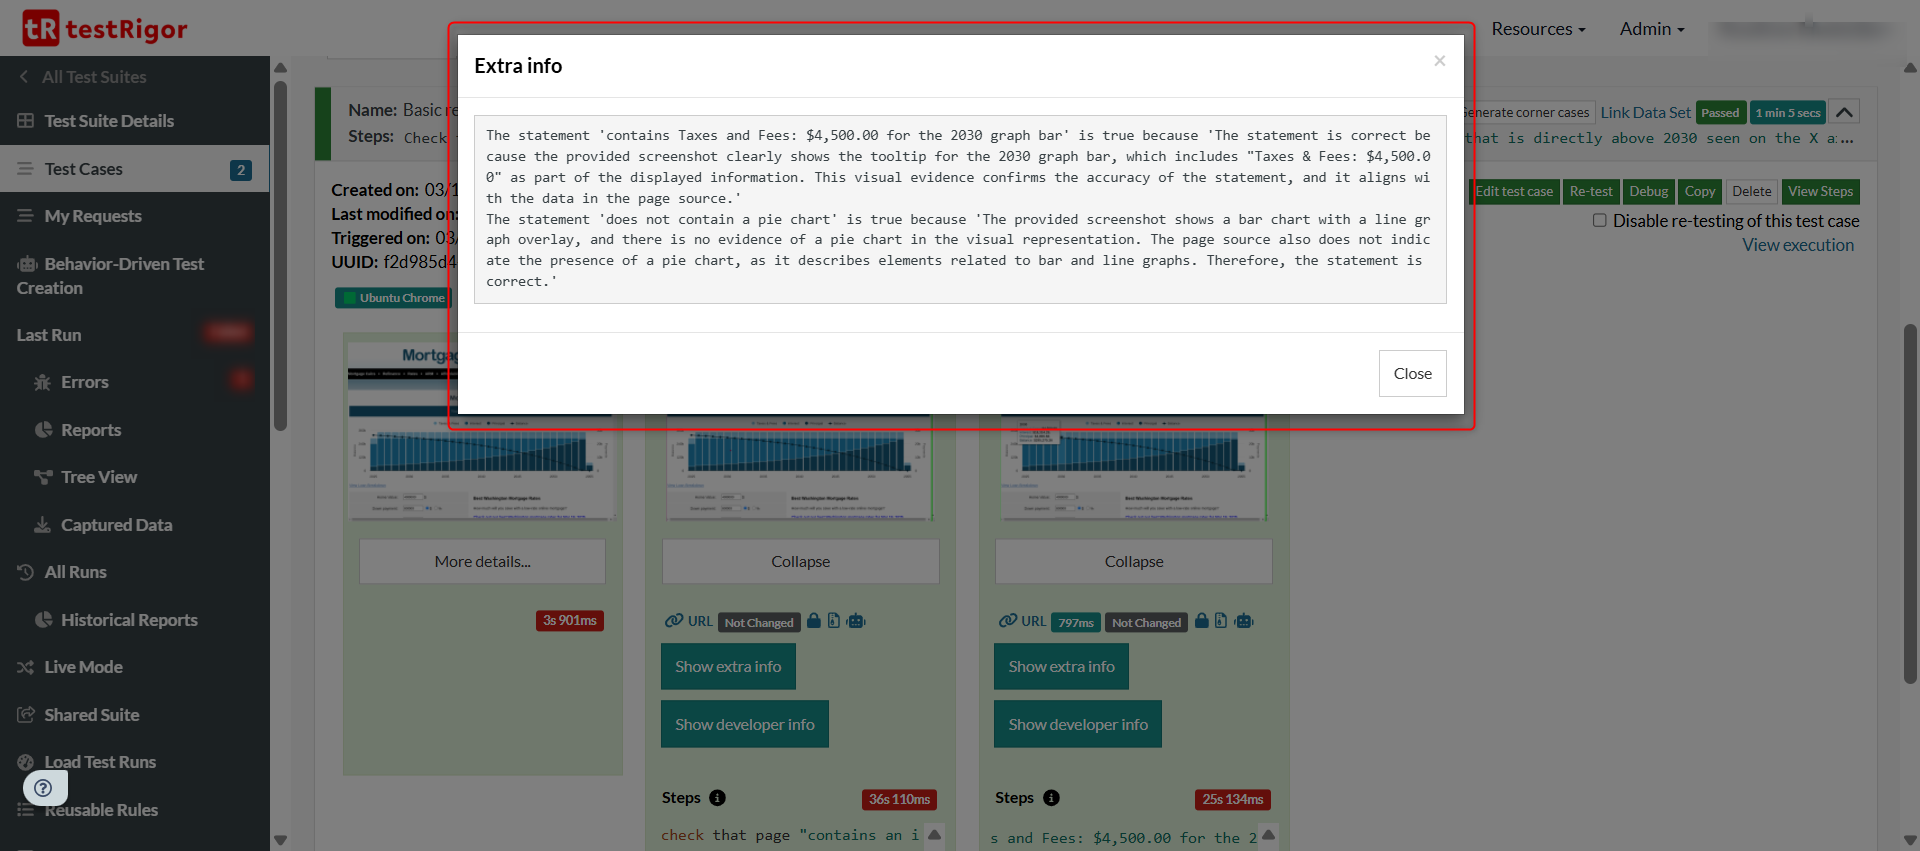
check that page “contains Taxes and Fees: $4,500.00 for the 2030 graph bar” using ai
check that page “does not contain a pie chart” using ai
As is with any prompt-based AI engine, you need to try a few times before you find the right prompt that gets you the desired results. But once that clicks, testRigor handles the rest.
testRigor captures screenshots of each and every step it executes, along with logs, errors, and more information.
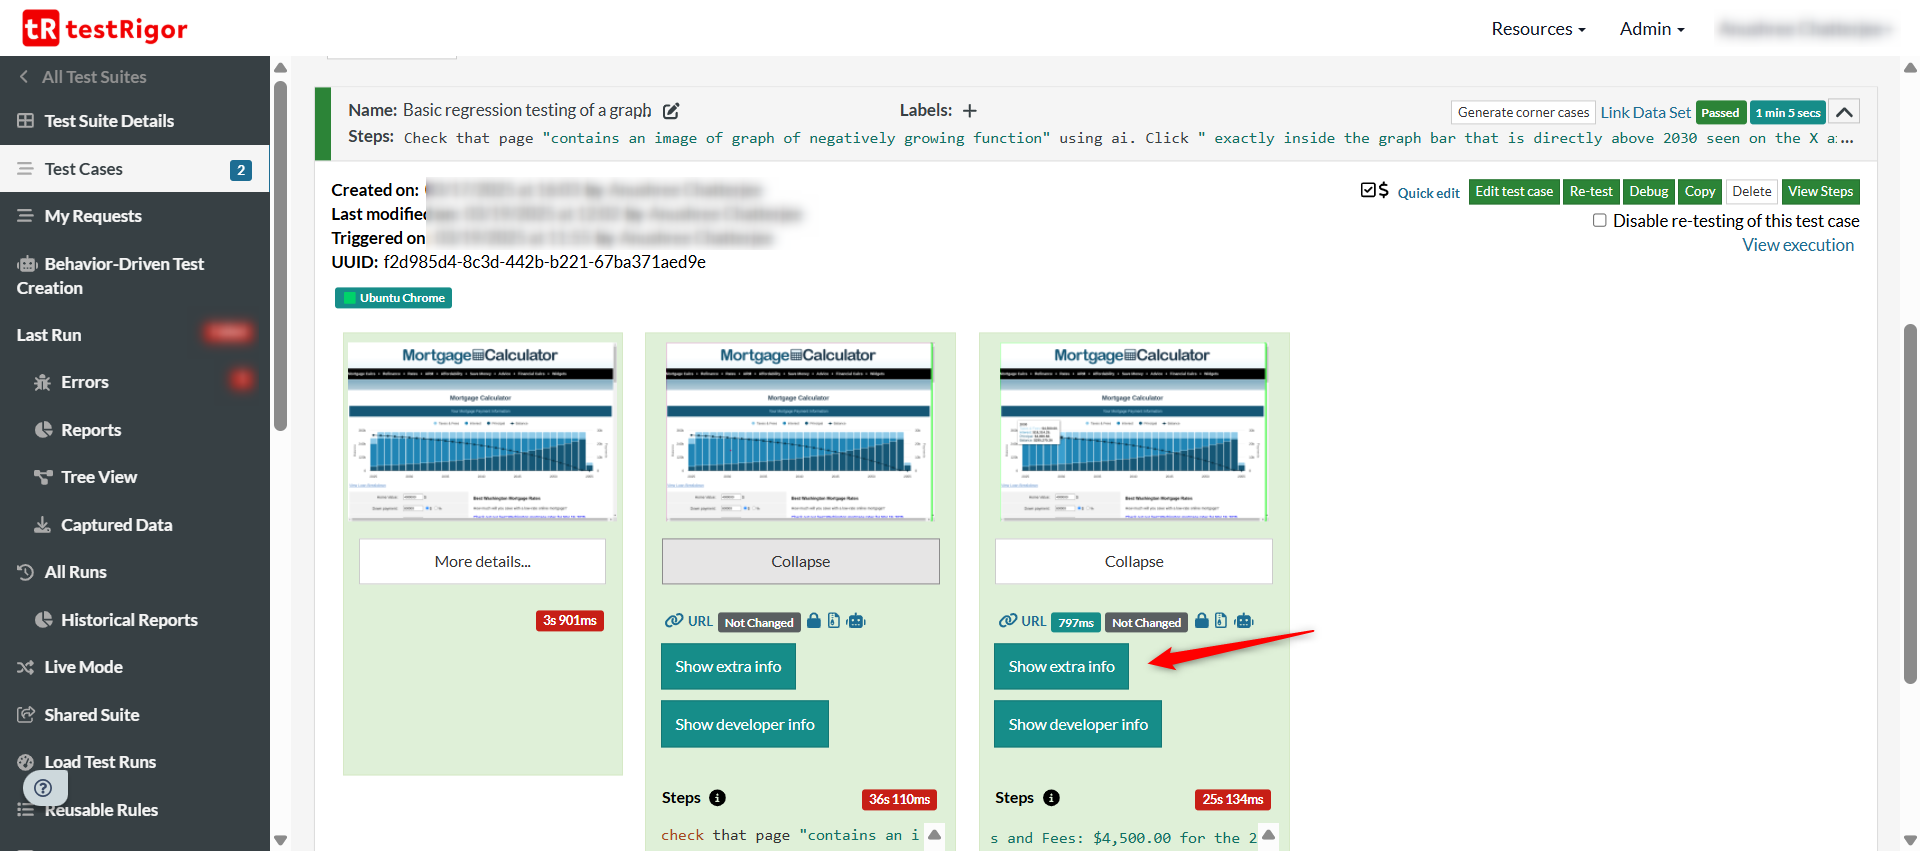
Under the “Show extra info” section, for every step that you test with the “using ai” feature, you can see the AI engine’s explanation for passing or failing it.
You can do a lot more with testRigor. Check out the complete list of features.
Conclusion
AI is transforming the way we approach graph testing by making it more efficient, adaptive, and capable of handling complex structures. While we may not be at the optimal level of automation when it comes to testing these complex data structures, what we have now definitely looks promising. The key is to use AI for testing wherever possible so that you can conserve your resources for other, more important tasks.
| Achieve More Than 90% Test Automation | |
| Step by Step Walkthroughs and Help | |
| 14 Day Free Trial, Cancel Anytime |