What is Mean Time Between Failures (MTBF)?
|
|
Mean Time Between Failures MTBF shows up everywhere in SRE dashboards, reliability reports, QA scorecards, RFPs, vendor datasheets, and audit documents. Yet it is also one of the most misunderstood metrics. People often treat MTBF like a promise that it will not fail for 6 months, a warranty that it will last 10000 hours, or a shortcut to claiming uptime and saying we are basically reliable.
But MTBF is not a guarantee or a commitment. It is a statistical reliability measure that only makes sense under specific assumptions and is valid only within a defined scope and operating context. It should be interpreted as an average over time and across a population, not as a prediction for any single system or any single period. Used correctly, it helps compare reliability patterns and track improvements, but it cannot replace real availability and incident data.
| Key Takeaways: |
|---|
|
What is MTBF?
MTBF is the mean time between any two successive failures in a repairable system. The repairable system part is important, as MTBF considers that the system may fail and then recover after a restart, replacement, rollback, or repair process, and operate normally until another failure.
From an operational point of view, a failure occurs at T1, the system recovers and operates once more, and then fails again at T2. Averages over many cycles of these times will give you MTBF, where the times between T2 and T1 are measured in terms of the above operating time rather than actual elapsed calendar time.
People like MTBF because it feels intuitive, where a higher MTBF suggests failures are rarer and a lower MTBF suggests failures are frequent. In that broad sense, it acts like a failure frequency expressed in time units, but the number only means what you think it means under specific assumptions.
Read: Most Frequent Reasons of Test Failures.
MTBF Calculation
- A production incident that impacts customers
- A severity-1 outage
- A breach of an SLO (Service Level Objective)
- A critical transaction failing beyond an error budget threshold
- Any event that requires human intervention to restore normal service
MTBF is driven by how failure events are counted. A team that tracks only Sev 1 incidents will report a very different MTBF than a team that includes Severity 1 through Severity 3 incidents, even when the underlying system behaves the same. This makes MTBF less of an absolute measure and more a direct outcome of how you define failure.
Read: Minimizing Risks: The Impact of Late Bug Detection.
The Basic MTBF Formula
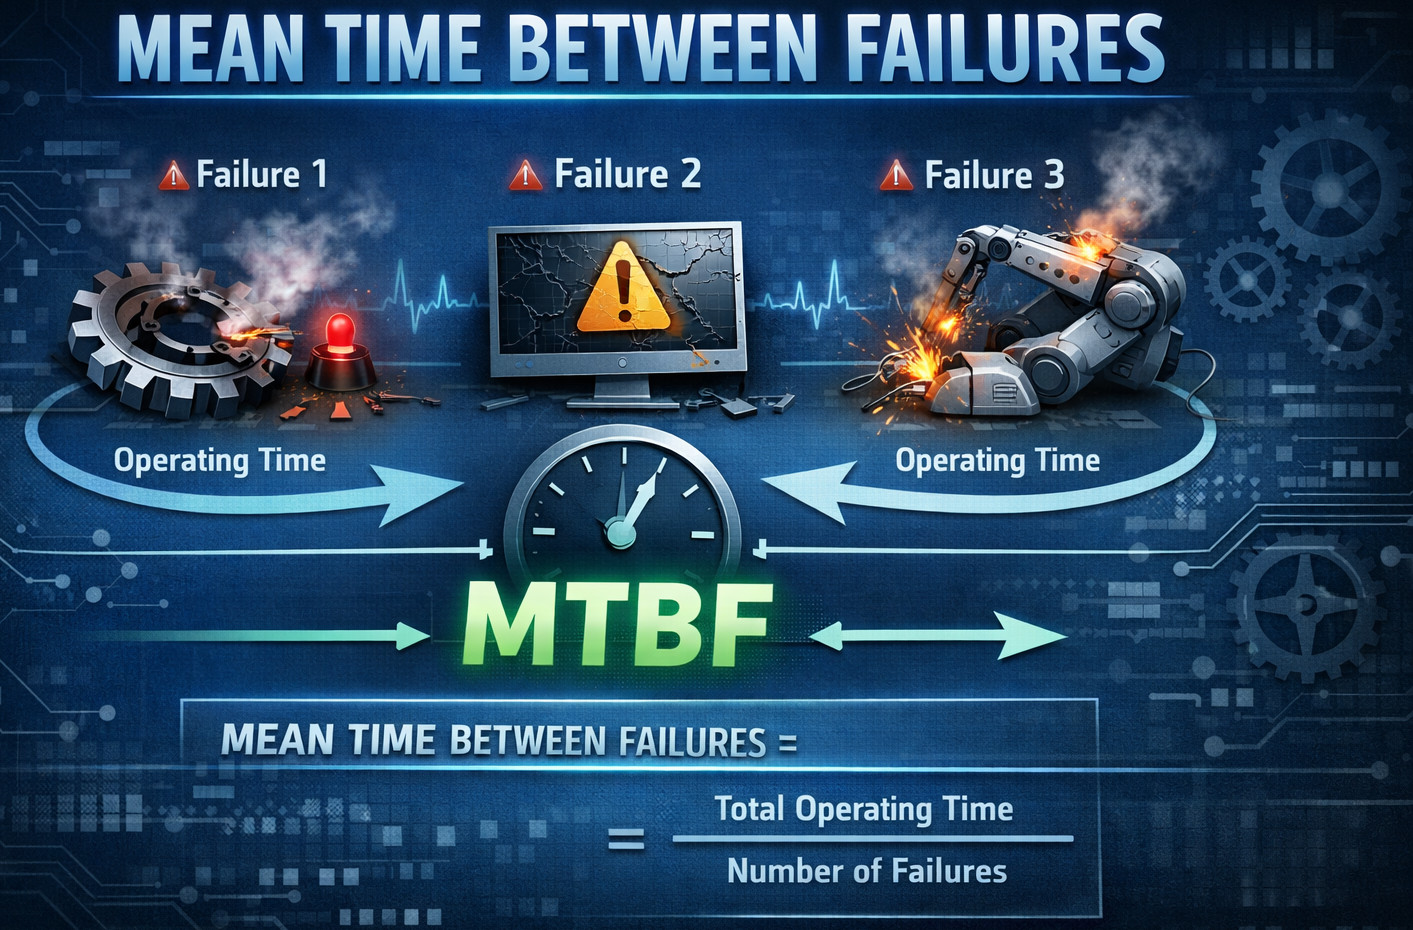
MTBF can be calculated by dividing the total operational time by the total number of failures.
MTBF = Total Operational Time / Number of Failures
- Total Operational Time is the sum of time the system is “operating” (in service).
- The number of Failures is the count of failure events in that period.
For example, suppose a service ran for 30 days (720 hours) and had 6 customer-impacting incidents. Then:
MTBF = 720/6 = 120 hours.
What we can interpret is that there was one failure every 120 hours.
MTBF vs. MTTF vs. MTTR: The Common Trio
Reliability discussions often group three related mean time metrics that describe how often things fail and how quickly they recover. Together, they help separate failure occurrence from recovery effort, so teams do not mix reliability with maintainability.
| Metric | Best used for | What it measures |
|---|---|---|
| Mean Time To Failure (MTTF) | Non-repairable items | Expected time until the first failure |
| Mean Time Between Failures (MTBF) | Repairable systems | Average operating time between successive failures |
| Mean Time To Repair or Restore (MTTR) | Any system after a failure | Average time to restore service, including diagnosis, fix, deployment, validation, and recovery time |
- MTTF tells you how long something lasts before it dies.
- MTBF tells you how long it typically runs between breakdowns.
- MTTR tells you how quickly you recover after a breakdown.
Read: Metrics for QA Manager.
Why does MTBF Matter?
- Quantifies stability over time: If MTBF increases, failures are happening less frequently, which usually indicates improved stability.
- Helps compare alternatives: When two options are similar, the one with higher MTBF often lowers incident cost, operational burden, and customer impact.
- Supports planning and risk management: MTBF can help forecast incident volume, on-call staffing needs, maintenance schedules, and spare capacity requirements.
- Enables trade-off discussions: Teams can explicitly weigh speed versus reliability by discussing how a change may increase or reduce MTBF.
MTBF is an Average, Not a Guarantee
If your MTBF is 15 days, that doesn’t mean you’re going to fail every 15 days like clockwork. It implies that over the period of observation, there were gaps between failures of 15 days on average. You could have two failures in one day, then 40 days without any failures, and a failure on day 41, and the average is still only 15 days.
That’s why reliability work usually combines MTBF with an assumed failure distribution, such as exponential, especially in hardware. For software, failure patterns can be highly affected by releases, configuration manipulations, high levels of traffic load or an external dependency and thus are not random-like. Therefore, MTBF can mask clustering and seasonality unless you examine the distribution of failures over time.
MTBF and Reliability: Are they the Same?
They are related but not identical. Reliability is a broad concept that describes the probability that a system performs correctly for a specified time under specified conditions. MTBF is just one quantitative summary that reflects observed failure frequency.
A system can have a high MTBF but still produce catastrophic failures when they occur. A different system can have a low MTBF, but failures may be minor and quickly mitigated. The impact and recovery characteristics matter as much as how often failures happen.
That is why MTBF alone does not capture quality or reliability in the way users experience it. To reflect what users feel, you also need measures like severity, customer impact, time to restore, and overall availability. MTBF is a piece of the story, not the whole story.
Read: Reliability Testing – A Complete Guide.
Interpreting MTBF Trends
MTBF is most useful when you track it over time, because the direction of the trend tells a clearer story than any single value. To interpret it correctly, always consider what changed in the system and in your measurement methods.
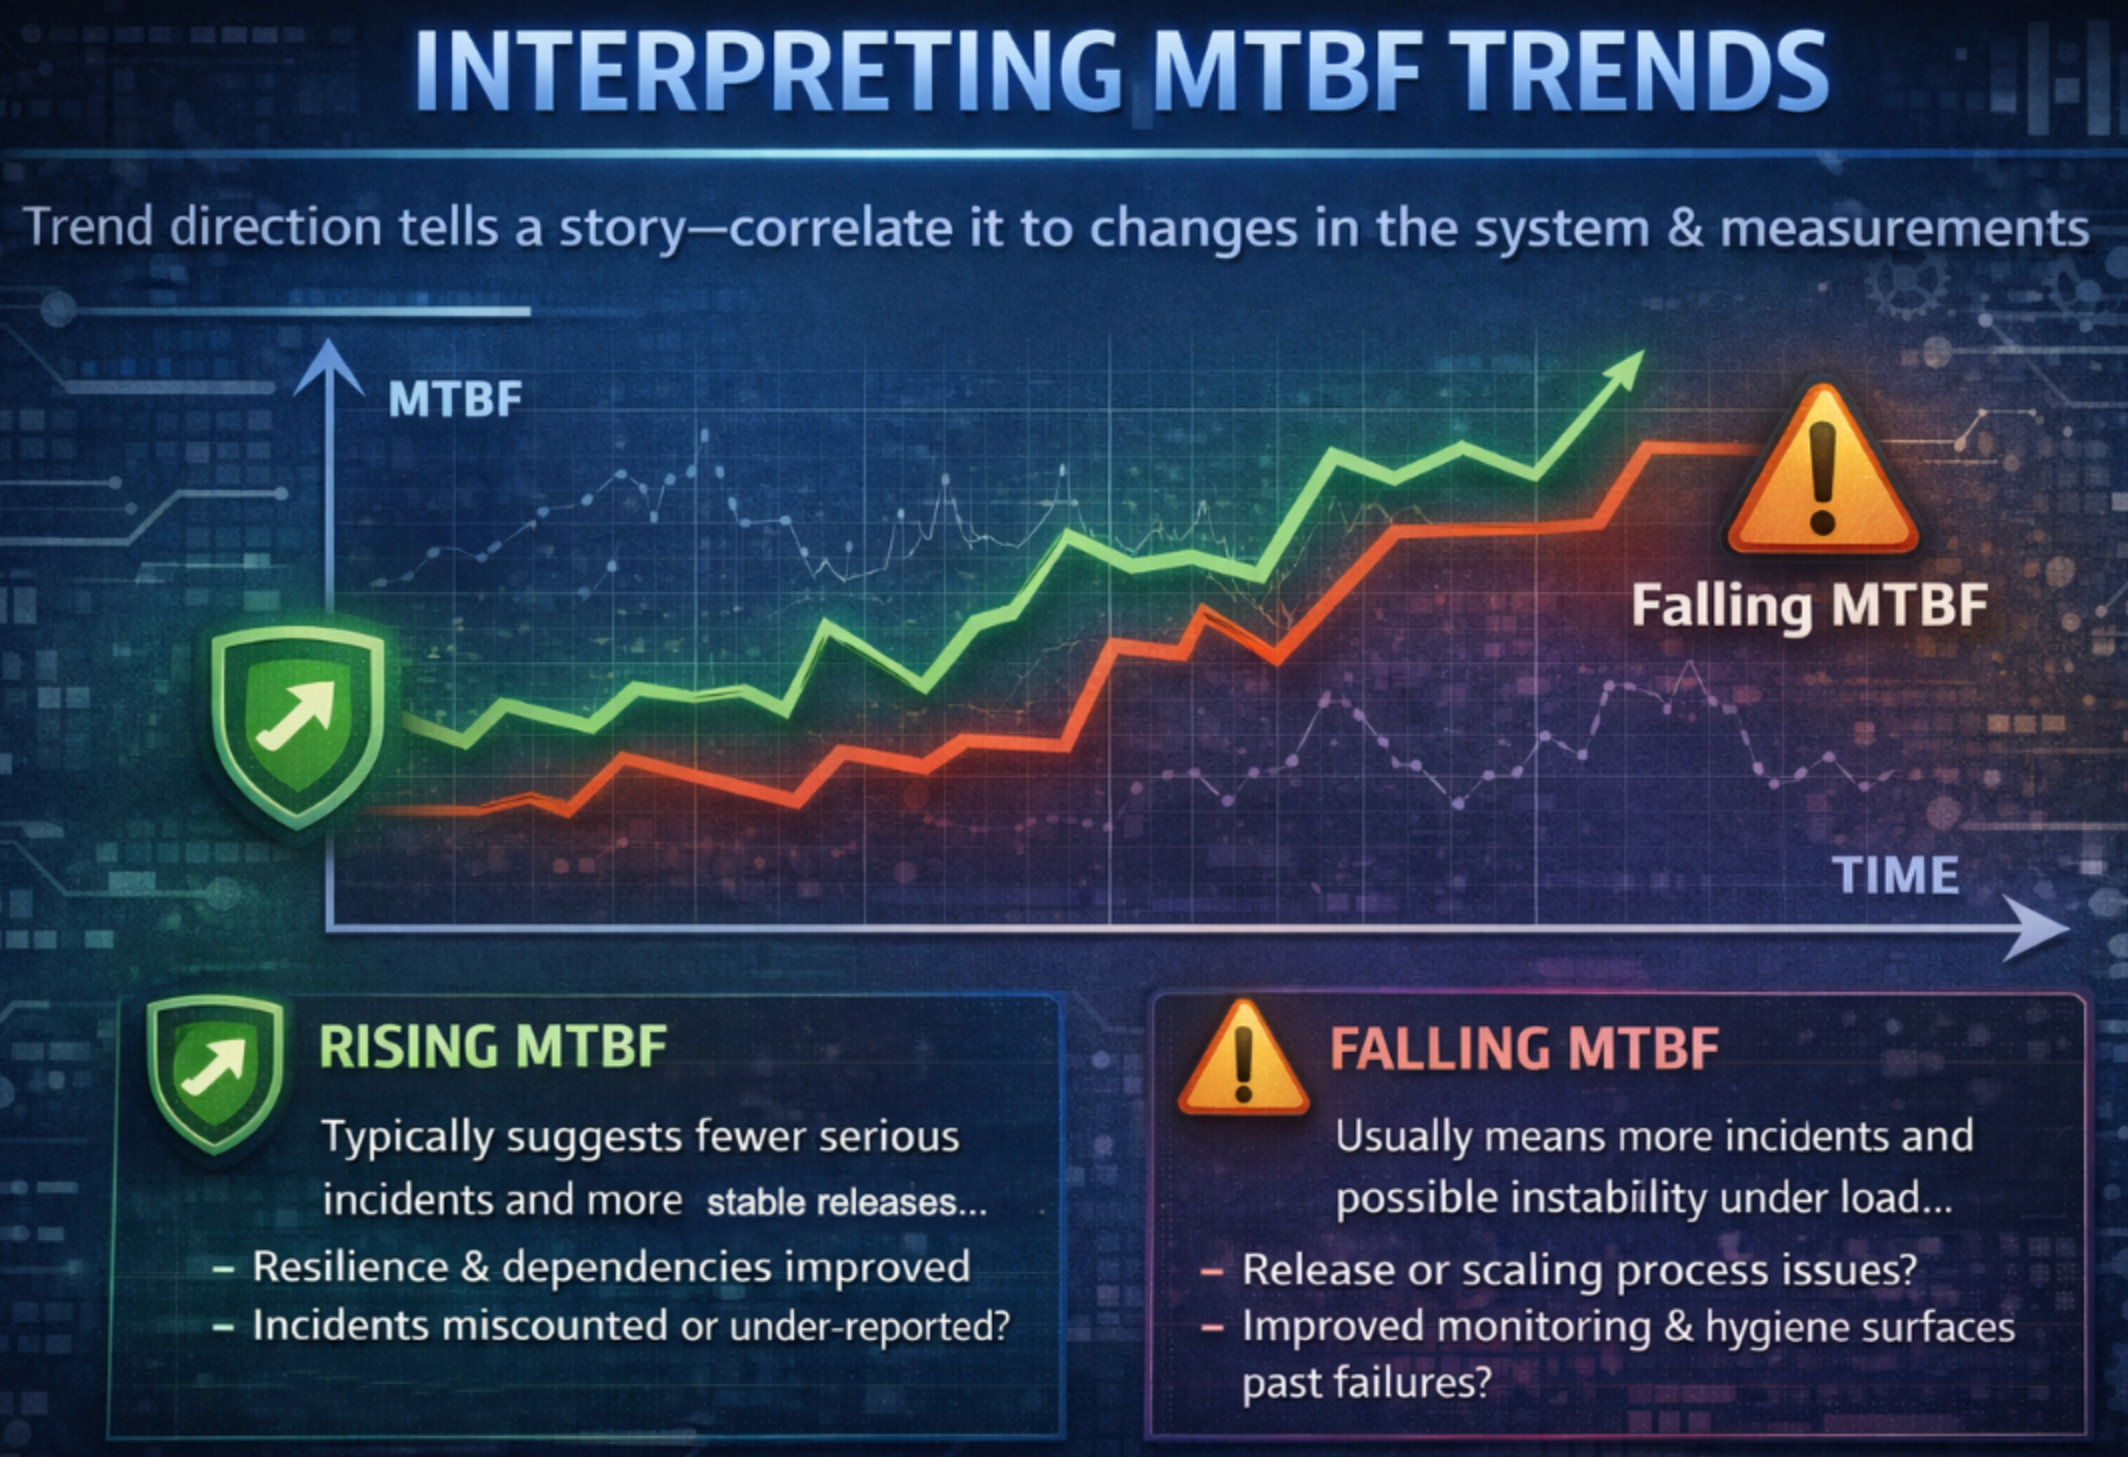
- Rising MTBF: Suggests the system is experiencing fewer serious incidents and is becoming more stable across releases, often reflecting stronger resilience and healthier dependencies. However, it can also be caused by under-reporting, monitoring blind spots, or changes in how incidents are classified.
- Falling MTBF: Indicates incidents are happening more frequently, often linked to unstable release processes, scaling issues under load, or growing complexity without enough reliability investment. At the same time, it may be a positive signal if improved monitoring and better incident hygiene reveal failures that previously went undetected.
Always add notes to MTBF charts when major events occur, so the trend is interpreted in the right context and not mistaken for purely “better” or “worse” reliability. Common annotations include architecture changes, incident classification updates, traffic shifts, new monitoring rollouts, and migrations or major platform moves.
MTBF, SLOs, & Error Budgets
If your organization uses SLOs and error budgets, MTBF becomes a supporting metric rather than the primary KPI. SLOs focus on the reliability you commit to deliver, while MTBF helps provide additional context about how incidents are occurring.
SLOs ask, “What level of reliability do we promise?” and error budgets quantify, “How much unreliability are we allowed in a period?” Together, they shift the conversation from abstract uptime numbers to a clear, measurable reliability contract and the acceptable room for failure.
MTBF then helps explain the pattern behind that unreliability: frequent small incidents (low MTBF) can burn the same error budget as rare but long-lasting incidents (high MTBF). This makes MTBF useful for understanding whether reliability pain is “death by a thousand cuts” or “big-bang outages.”
In SLO-driven teams, automation supports the error budget strategy: tighter validation of SLO-critical journeys reduces the number of customer-impacting incidents that burn budget. For example, testRigor can be used to continuously validate the same top user flows that your SLO implicitly depends on (login, checkout, payments, onboarding), helping prevent budget burn caused by regressions.
Read: Decrease Test Maintenance Time by 99.5% with testRigor.
MTBF as a Leading and Lagging Indicator
MTBF is a lagging metric; it tells you what already happened, not what’s about to happen. To improve MTBF proactively, pair it with leading indicators that show reliability risk building up before customers feel it.
Useful leading indicators include change failure rate (how many releases cause incidents), coverage of critical end-to-end flows, and production guardrail results like smoke tests and synthetic monitoring. Add resilience test outcomes (fault injection/chaos), dependency risk metrics (outdated libraries or failure-prone vendors), and alert quality (signal-to-noise) to keep teams focused on actionable levers. These signals are often more effective for engineering teams than obsessing over MTBF alone.
One practical leading indicator is critical-path test health: whether your most important end-to-end flows are continuously validated? Teams often use testRigor to keep those flows automated with lower maintenance overhead, making it easier to sustain reliable coverage as the UI evolves, reducing the chance that a release introduces a user-visible failure.
Ways to Increase MTBF
You don’t increase MTBF by measuring harder; you increase it by reducing real failures and how often they reach customers. The most effective approach is to work across the lifecycle: prevent failures, control how change ships, limit blast radius, and build resilience.
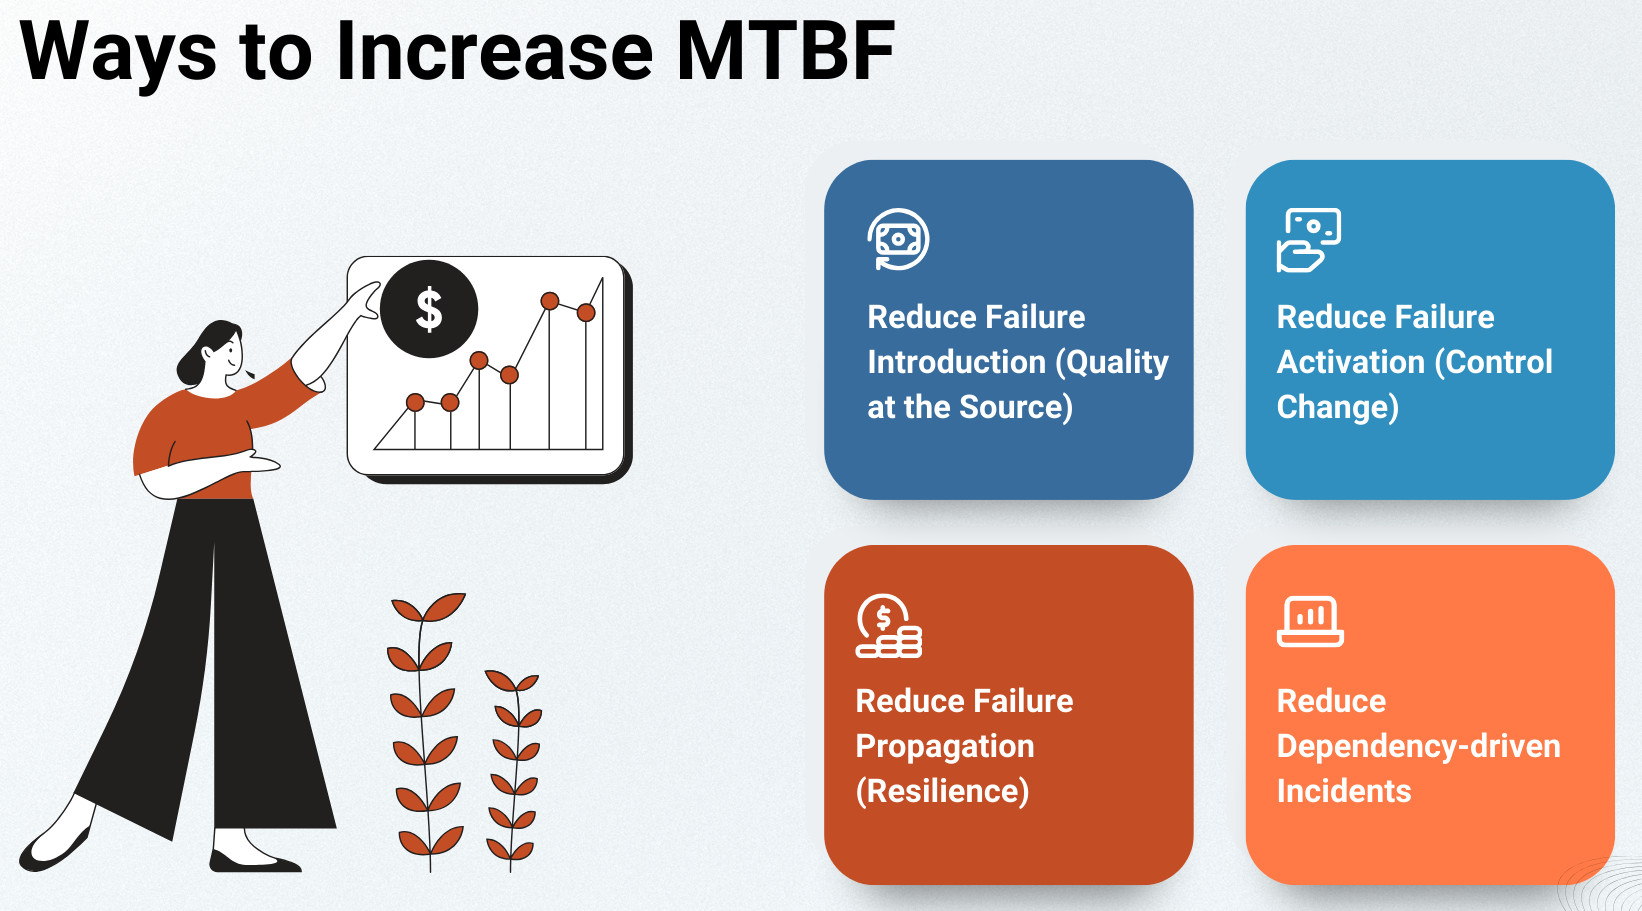
- Reduce Failure Introduction (Quality at the Source): Prevent defects from entering production by strengthening reviews in risky areas and using pre-merge automated tests that focus on critical paths. Add static analysis/security scanning and keep regression suites aligned to real production hotspots.
Teams can improve MTBF by catching regressions before they reach customers. Tools like testRigor help by enabling broad, maintainable end-to-end coverage of critical user journeys (especially for fast-moving UIs), so more failures are prevented during CI rather than discovered as production incidents.
- Reduce Failure Activation (Control Change): Make changes safer through progressive rollouts (canaries), feature flags with safe defaults, and configuration validation that catches bad deployments early. Reduce blast radius by isolating tenants/regions so one failure doesn’t become a widespread incident.
MTBF also improves when risky changes are detected early in rollout. For example, running testRigor smoke tests against canary or staging environments can surface customer-impacting breaks before a full release, reducing how often deployments turn into incidents.
- Reduce Failure Propagation (Resilience): Design services to absorb faults using timeouts, retries with backoff, circuit breakers, and bulkheads to stop cascades. Use graceful degradation, load shedding, and rate limiting so traffic spikes or runaway clients don’t take everything down.
- Reduce Dependency-driven Incidents: Treat critical vendors and internal dependencies as reliability surfaces by setting SLOs and monitoring them like first-class systems. Build fallback modes for degradation, and add multi-region or multi-provider resilience when the business impact justifies the complexity.
Closing Thoughts
MTBF is a statistical average that summarizes how frequently a repairable system fails, based on a clearly defined failure event. It is useful for comparing reliability patterns and tracking improvement trends over time. However, MTBF is not a guarantee that the system will run for that long without failing, and it can hide clustered or seasonal failure behavior. For a complete reliability view, interpret MTBF alongside severity/customer impact, MTTR, and SLO/error-budget results.
Frequently Asked Questions (FAQs)
Is MTBF the same as uptime or availability?
No. MTBF measures how often failures occur on average, not how available a system is. Availability depends on both how often failures happen (MTBF) and how quickly the system recovers (MTTR). A system can have a high MTBF but poor availability if each failure takes a long time to fix.
Does a higher MTBF mean a more reliable system?
Not always. A higher MTBF means failures happen less frequently on average, but it does not account for failure severity or customer impact. A system that fails rarely but causes major outages can feel less reliable to users than one that fails more often but recovers quickly with minimal impact.
What counts as a failure when calculating MTBF?
That depends entirely on how your organization defines failure. In software systems, a failure could be a Severity-1 outage, an SLO breach, a customer-impacting incident, or any event requiring human intervention. MTBF is only meaningful when this definition is explicit and consistently applied.
How is MTBF different from MTTF?
MTTF applies to non-repairable systems and measures time until the first failure. MTBF applies to repairable systems and measures average operating time between successive failures. Most software services use MTBF, not MTTF.
Should MTBF be a primary KPI?
Usually no. MTBF works best as a supporting metric. Primary reliability KPIs are typically SLO compliance, error budget burn, and customer-impact measures. MTBF adds context but should not be treated as a standalone reliability score.
| Achieve More Than 90% Test Automation | |
| Step by Step Walkthroughs and Help | |
| 14 Day Free Trial, Cancel Anytime |