What is QE or Quality Engineering Score?
|
|
There used to be a time when Quality Assurance (QA) was like the grim reaper – swooping in at the very end to deliver the bad news: “Nope, this won’t fly.” We’ve come a long way since those days of post-mortem bug hunts. Today, it’s not about finding the bodies after the fact. We proactively engage in Quality Engineering (QE) where QA is a part of the system’s DNA.
“Without data, you’re just another person with an opinion” – W. Edwards Deming.
You still need a way to determine how your application is performing. What if you could put a number on your software’s overall resilience, its performance, its very “goodness”? That’s where the Quality Engineering Score steps in.
Key Takeaways
- A QE Score is a custom, composite metric that reflects the health and quality of your software. It combines data across testing, performance, automation, and user satisfaction to offer a holistic view.
- QE thrives on shift-left testing, test automation, CI/CD, performance and security checks, and DevOps culture.
- Start by aligning the score with your specific definition of “quality.” Pick 5-10 high-impact metrics, set baselines, and choose a scoring method (weighted, categorical, or dashboard view).
- Use tools like testRigor, Jira, GitHub Actions, SonarQube, and Datadog to gather and visualize data. Automated data pipelines reduce manual effort and improve metric reliability.
- Avoid chasing scores at the expense of real quality, and don’t silo ownership of the metrics.
In this article, we’ll pull back the curtains on what Quality Engineering Score is and how it can help you.
But first, let’s quickly look at what QE is, and then, we can learn ways to quantify it.
What is Quality Engineering (QE)?
If you’ve been around the software block a few times, you’re probably familiar with “QA” – Quality Assurance. For a long time, QA was the superhero (or sometimes, the scapegoat) who swooped in at the very end of the development cycle to find all the nasty bugs. It was reactive, a gatekeeper function.
Then came its proactive counterpart – Quality Engineering (QE). It goes way, way beyond just testing. Think of it less like a final inspection and more like building a house with quality materials and craftsmanship from the very first blueprint. In QE, the goal isn’t just to find bugs; it’s to prevent them from ever showing up in the first place. It’s about embedding quality into every single step of the software development lifecycle (SDLC), to make it an intrinsic part of how we build things, not an afterthought.
Core Elements of QE
If you look at QE implementations, you will see these practices.
- “Shift-Left” Testing: This is a huge one. Instead of waiting until the code is almost ready for release, QE pushes testing and quality activities earlier in the development process. We’re talking about reviewing requirements for clarity, writing tests even before the code is fully written, and constantly testing small chunks of functionality as they’re developed. Catching a bug when it’s just an idea is infinitely cheaper and easier than finding it days before launch. Here’s more on this topic – Shift Left Testing – Software Testing Done Early.
- Automation: Manual testing is great for exploration and user experience, but it’s slow, prone to human error, and doesn’t scale. QE leans heavily into automating everything from unit tests (testing tiny pieces of code), to integration tests (making sure different parts of the system play nicely), to even deploying the software itself. This frees up human minds for more complex, creative testing and ensures rapid, consistent feedback. Here are some great resources to help improve automation testing:
- Continuous Integration/Continuous Delivery (CI/CD): Picture merging your code, testing it automatically, and deploying it directly to a staging environment (or production!) multiple times a day. That’s the influence of CI/CD, one of the pillars of QE. Developers will receive immediate feedback if the changes break anything. This results in faster resolutions and a significantly more fluid, rapid-release pipeline. Learn more about CI/CD over here – What Is CI/CD?
- Collaboration (The DevOps Culture): This is the glue for QE. It tumbles down the age-old silos between developers, testers, operations and yes, even product teams. Everyone is responsible for quality and collaborates from the inception to the production stage. It is a team sport, not a passing of the baton. Learn more about DevOps over here – What is DevOps?
- Performance Engineering: Software should not just work; it should work well. QE involves integrating performance testing throughout the development process. It finds the bottlenecks and ensures that the application will not crash or slow down to a crawl with the expected number of users.
- Security Testing: Security is no longer a choice but a must-have in our present times. Incorporating security testing directly into the SDLC, QE proactively identifies risks through static code analysis, dynamic testing, and security audits.
- User Experience (UX) Quality: Quality is not creating an app that is technically flawless, but a nightmare to use. QE focuses on the user’s pathway to make sure that software is built to be more usable, accessible, and pleasant. Even if the code works perfectly, it doesn’t matter if the users cannot figure it out.
Here’s a more in-depth take on QE and how to implement it – Quality Assurance to Quality Engineering Transformation – A Guide
What is Quality Engineering Score?
A Quality Engineering Score is a way to measure the overall quality of a product in software development. It helps teams figure out how well their software is performing in terms of reliability, functionality, and user experience.
Since the QE Score is a collection of different metrics, it gives a holistic view; after all, no single metric can tell the whole picture. There isn’t one single, universally agreed-upon “QE Score” that every company uses. It’s not like an SAT score where everyone gets the same test. Instead, a QE Score is a customized metric, or more often, a collection of metrics, that an organization defines for itself based on what quality means to them and what their specific goals are. What’s paramount for a banking app might be different from what’s most critical for a gaming company. Think of it less as a single number on a report card and more like a health dashboard for your software, filled with various indicators that, when combined, give you a comprehensive picture.
Common Candidates of Quality Engineering Score
While the exact formula might differ, there are certainly common categories and components that most robust QE Scores will consider. Let’s look at the key ingredients:
- Defect Metrics: This is often the first place people look, and for good reason. It tells you about the quality of what you’re delivering.
- Defect Density: How many bugs per thousand lines of code, or per major feature? Lower is better!
- Defect Escape Rate: This is a big one. How many bugs are slipping through your internal checks and getting found by actual users in the wild (i.e., production)? If your escape rate is high, your internal quality gates might be leaky.
- Mean Time To Resolve (MTTR) Defects: Once a bug is found, how long does it take your team to fix it and get the fix deployed? A shorter MTTR means you’re agile in responding to issues.
- Severity of Defects: Are the bugs found critical, blocking users, or minor cosmetic glitches? The impact matters.
- Test Automation Metrics: Since automation is a cornerstone of QE, measuring its effectiveness is vital.
- Automation Coverage: What percentage of your code is covered by automated tests? Are your critical features protected? This isn’t just about lines of code; it’s about the breadth and depth of your automated checks.
- Test Execution Time (Automated vs. Manual): How long does it take to run your automated test suite compared to how long manual testing would take? Faster automated runs mean quicker feedback loops.
- Flaky Test Rate: Are your automated tests unreliable, sometimes failing for no clear reason? Flaky tests erode trust and slow down development. You want this number to be as close to zero as possible.
- CI/CD & Release Metrics: Quality isn’t just about what you build, but how smoothly and quickly you can get it to your users.
- Deployment Frequency: How often are you releasing new code to production? More frequent, smaller releases typically mean lower risk and faster delivery of value.
- Lead Time for Changes: How long does it take for a code change to go from “committed” to “running in production”? A shorter lead time indicates a highly efficient pipeline.
- Change Failure Rate: What percentage of your deployments cause a production incident or rollback? A low failure rate shows high confidence in your changes.
- Mean Time To Recover (MTTR) from Failure: If something does go wrong in production, how quickly can you fix it and restore service? This speaks to your resilience.
- Performance Metrics: Speed and stability are non-negotiables for user satisfaction.
- Response Times, Throughput, Error Rates: These come directly from your performance testing. Is your application fast enough under load? Can it handle all your users without crumbling? Are errors popping up under stress?
- Security Metrics: No one wants to be the next big data breach headline.
- Vulnerability Density: How many security weaknesses are found per scan or per feature?
- Time to Remediate: How quickly are identified security vulnerabilities being patched?
- Customer/User Feedback: Ultimately, the true judge of quality is the user. While not a direct QE metric, this is a vital indirect indicator.
- Net Promoter Score (NPS) related to software quality: Are your users raving about your product, or constantly complaining about bugs?
- User reviews and support tickets related to quality: Are common themes emerging about frustrating glitches or performance issues? This qualitative data can provide crucial context for your numbers.
- Code Quality Metrics: The quality of your code directly impacts its maintainability and the likelihood of introducing future bugs.
- Code Complexity: Is your code tangled and hard to understand, or clean and modular?
- Technical Debt: How much “mess” has accumulated in your codebase that needs to be cleaned up? Read: How to Manage Technical Debt Effectively?
- Static Analysis Findings: Are tools automatically flagging potential bugs, security holes, or bad practices in your code before it even runs?
Here are some good articles that sum up the different types of metrics and why you should incorporate them into your project:
- Why Project-Related Metrics Matter: A Guide to Results-Driven QA
- Essential QA Metrics to Improve Your Software Testing
- QA Testing KPIs: Driving Success Through Measurable Metrics
How to Measure and Calculate Your QE Score
- Define Your Targets: What is “Quality” to you? Before going crazy collecting data, stop for a moment. What, exactly, is “quality” for your product, your team, your users? Is zero production bugs absolutely necessary for you? Or is the top priority delivery speed? Or is it flawless handling of huge user loads? Your QE Score should reflect your strategic desires. For example, if customer satisfaction is key, then metrics tied to bug escape rates and MTTR for critical defects will be heavyweights. For a trading platform that has to be blazingly fast, performance metrics will be much more important. Don’t mechanically copy someone else’s list – make it right for your environment.
- Identify Key Metrics: Once you’ve designed your goals, pick from the various types of metrics we talked about (defect rates, automation coverage, deployment frequency, etc.) Those 5-10 Measures that are most important for your goals. Don’t try to do everything at once because you’ll simply be overwhelmed with all those numbers flooding in on top of one another. Begin small, concentrate on the most impactful measures. For example, if you’re in the midst of debugging production programs, your chief indicators might be: Defect escape rate, MTTR for production defects, and possibly automation coverage (to tell whether more automation leads to fewer bugs).
- Establish Baselines: If you don’t know where you began, then how can you tell whether you’re actually making any improvements? So, before you begin making changes, measure your current performance level for all the key metrics you have chosen. This is your starting point. It might look terrible, and that’s okay! The goal is not for day 1 to paint a perfect picture, but to know where you are beginning and celebrate the progress.
- Choose a Scoring Methodology: This is where you decide how you’ll aggregate all your chosen metrics into something meaningful. Remember, there’s no single “right” way.
- Weighted Averages: It’s a popular one, and for a good reason. You assign a “weight” (i.e., a percentage importance) to each metric. For instance, if defect escape rate is of vital importance, it might be given a 40% weight, while automation coverage is only 20%, and so on. Then score each measure (e.g., 1-10) and multiply by its weighting. This gives you a single, overall number.
- Categorical Scores: Sometimes, a single number simplifies too much. You might just give each major category (e.g., “Defect Management,” “Automation,” “Delivery Performance”) a score (e.g., “Excellent,” “Good,” “Needs Improvement,” or a 1-5 rating). This provides a more nuanced view without forcing everything into one number.
- The “Dashboard” Approach: It often makes sense for many teams just to create a visual “scoreboard,” with all of their key metrics lined up next to one another. There is no one overall “QE Score” number, but the overall picture is immediately apparent. And this is a very practical way for most teams to get started.
- Tools for Data Collection: You do not have to do every calculation by hand in a spreadsheet. There are exceptional tools that can carry the load for you:
- Test Management Tools (Jira, Azure DevOps, TestRail, etc.): Great for tracking defects, test cases, and execution results.
- Test Automation Tools: Some intelligent test automation tools like testRigor give you a good picture of how your automation testing is going. You can get detailed reports sharing different numbers that can help you draw up necessary conclusions.
- CI/CD Pipelines (Jenkins, GitLab CI, CircleCI, GitHub Actions): These are goldmines for release metrics like deployment frequency, lead time, and build/test success rates.
- Monitoring & Observability Tools (Datadog, New Relic, Prometheus): Essential for capturing performance metrics from production and sometimes even security incidents.
- Static Code Analysis Tools (SonarQube, Checkmarx): Will help you with code quality metrics like complexity and technical debt.
The key is to integrate these tools so they can automatically feed data into your chosen dashboard or reporting system.
- Regular Reporting and Review: Measuring your QE Score isn’t a one-time event; it’s a continuous process. Schedule regular meetings (e.g., weekly, bi-weekly, monthly) to review your QE dashboard. Discuss what’s going well, what areas are red, and brainstorm why metrics are changing. This consistent review is where you get the actionable insights that truly drive improvement.
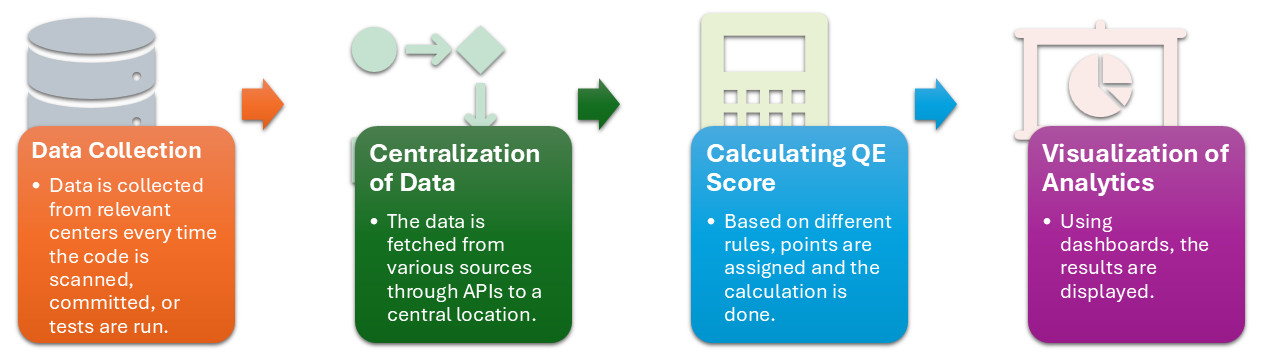
General Overview of Automated QE Score Calculation
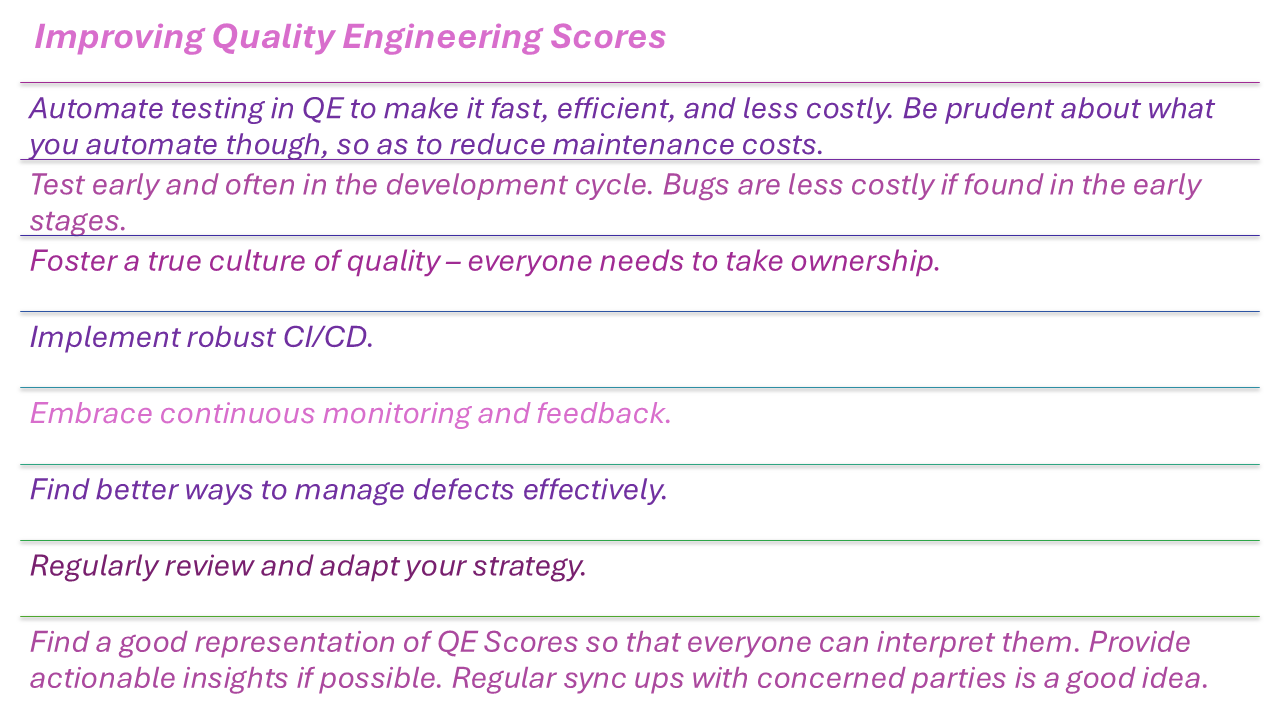
Strategies for Improving Your QE Score
Common Pitfalls to Avoid When Working with QE Scores
- The “Chasing the Number” Trap: It’s easy to get fixated on pushing that numerical score higher and higher. You might start manipulating data, focusing only on easily improvable (but not necessarily impactful) metrics, or even cutting corners elsewhere just to make the score look good. But if you’re just optimizing for the number itself, you might lose sight of the actual quality you’re trying to build.
- Ignoring the “Why”: A number is just a number without context. Always pair your metrics with qualitative understanding. When a metric changes significantly, ask questions: What happened around that time? What processes changed? Talk to the engineers, the testers, the product managers.
- More Automation Doesn’t Always Mean Better Quality: You might have lots of automated tests, but if they’re testing the wrong things, are constantly flaky, or don’t provide useful feedback, they’re just dead weight. Focus on effective automation. Are your automated tests stable? Are they testing the most critical user flows? Do they provide fast, reliable feedback? It’s about the quality of automation, not just quantity.
- Siloed Ownership: If the QE Score is seen as solely the responsibility of the “quality team” (whether that’s QA, SDETs, or a dedicated QE group), you’ve missed the entire point of Quality Engineering. Promote shared ownership and make it a collective goal for everyone – developers, product managers, and operations – to contribute to improving it.
- Analysis Paralysis: It’s easy to get excited and want to track every single thing that could possibly relate to quality. You’ll drown in data, spend more time collecting and reporting than actually improving, and your team will get overwhelmed and disengaged. Start small. Choose 3-5 truly impactful metrics that align with your immediate goals. Get those right, understand them, and then gradually add more as needed. Simplicity often leads to clearer insights.
Conclusion
“If you can’t measure it, you can’t improve it” – Peter Drucker.
QE Score is a good way to maintain a health check of your application. By constantly measuring different aspects of your application’s behavior, you are making sure that all those involved are aware of what’s happening. This information is very helpful for everyone to improve their stance and make quality engineering a success.
| Achieve More Than 90% Test Automation | |
| Step by Step Walkthroughs and Help | |
| 14 Day Free Trial, Cancel Anytime |