Root Cause Analysis Explained
|
|
“If you define the problem correctly, you almost have the solution” – Steve Jobs.
The above quote explains a sentiment that is often overlooked in today’s busy world. You might have seen many simply applying superficial patches to take care of the symptoms just so that the product can be shipped out at the scheduled time. But how often do you see someone going back to that symptom, digging deeper, and coming up with a solution that eliminates the problem from the root?
Let’s understand root cause analysis (RCA) in depth.
What is Root Cause Analysis?
Root Cause Analysis (RCA) is a problem-solving method used to find the underlying reason or cause of a problem. Instead of just fixing the symptoms of an issue, RCA digs deeper to figure out what started the problem in the first place. It’s like when you get a flat tire on your bike – you don’t just replace the tire, but you check to see if something caused it, like a nail in the road or a puncture, so you can fix that issue and avoid it happening again in the future. In business or any other field, RCA helps prevent problems from reoccurring by addressing the source, not just the effect.
Root Cause Analysis Format
Here’s a flowchart to show you how a RCA generally looks like:
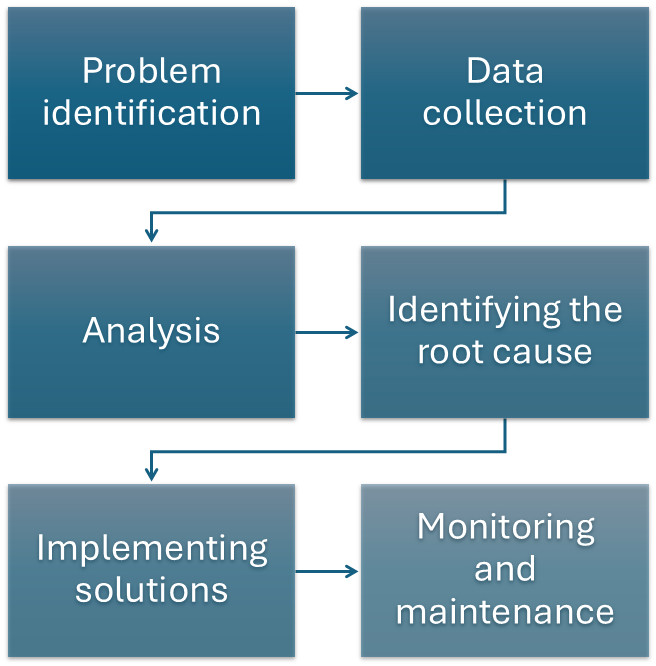
- Problem Identification: Recognizing that there’s an issue to address.
- Data Collection: Gathering relevant data to understand the context and nature of the problem.
- Analysis: Breaking down the data and understanding the sequence of events or actions that led to the issue.
- Identifying the Root Cause: Looking for the underlying causes (not just symptoms).
- Implementing Solutions: Putting measures in place to correct the root cause.
- Monitoring and Maintenance: Ensuring the solution works and preventing recurrence.
Why is RCA Important?
RCA can help you improve your product and associated processes. Here’s why it is important.
- Prevents Recurring Problems: When you only fix the surface-level issue, it’s likely that the problem will come back. With RCA, you dig deep to find the real cause and address it. This means you don’t waste time and resources fixing the same thing over and over again.
- Saves Time and Money: Fixing a problem at its source can save a lot of time and money in the long run. If you keep addressing just the symptoms, you’ll continue spending money and effort without solving the underlying issue. By finding and fixing the root cause, you eliminate the need for constant repairs or workarounds.
- Improves Processes: RCA is often used to improve processes. If there’s an ongoing issue in how something is done, like a team’s workflow or how a product is made, RCA can help you identify what’s breaking down the process. Fixing that weak point means everything will run more smoothly and efficiently in the future.
- Increases Quality: By resolving the underlying issues that cause problems, the overall quality of the product improves. Whether it’s a product defect, a software bug, or a team performance issue, RCA helps make sure that the quality of your work improves over time.
- Reduces Stress and Frustration: Constantly dealing with the same problem is exhausting. It creates stress for teams, customers, and anyone involved. RCA helps get to the heart of the issue, which means less frustration for everyone and a better working environment overall.
- Helps in Decision Making: When you understand the root cause of a problem, you can make better decisions. It helps you avoid making temporary fixes that may lead to bigger issues later. You can also make more informed choices about how to allocate resources, whether it’s time, money, or manpower.
- Prevents Bigger Issues Down the Road: A small issue today can turn into a major disaster in the future if not addressed properly. RCA will help you catch those small problems early before they spiral out of control. By fixing them at the root, you stop them from growing into something that could be much more damaging or costly. Read: Minimizing Risks: The Impact of Late Bug Detection.
- Builds Trust: Whether in a company or with customers, people trust organizations that solve problems correctly and effectively. If you’re always fixing problems at the surface level, people will lose confidence. But when you take the time to understand the root cause and solve it, you build trust and a reputation for reliability.
- Continuous Improvement: RCA isn’t just about fixing one problem; it’s about creating a culture of continuous improvement. By consistently identifying root causes and addressing them, you create an environment where things keep getting better over time. This approach leads to growth and innovation.
- Helps Identify Patterns: Sometimes, a single problem might seem isolated, but through RCA, you can uncover patterns. You might discover that several problems are connected and can be solved by fixing one underlying issue. This way, RCA helps prevent new problems from arising in the future.
Root Cause Analysis Techniques and Examples
There are many ways for you to perform an RCA.
The 5 Whys
The 5 Whys technique is a simple but powerful way to solve problems by asking “why” multiple times. The idea is that by repeatedly asking why something happened, you can dig deeper into the root cause of the issue instead of just fixing the surface-level symptoms. It’s like peeling back the layers of an onion until you reach the core problem.
Here’s how the 5 Whys work.
- Identify the Problem: Start by clearly identifying the problem you want to solve. This is the issue that needs to be addressed. It could be anything from a bug in a software product to a performance issue in your company.
- Ask “Why?”: Once you have the problem, ask, “Why did this happen?” The answer you get might point to a cause, but it’s often not the root cause. It’s just one step in the chain of events that led to the problem.
- Ask “Why?” Again: Now, take the answer from the first question and ask, “Why did that happen?” The answer will lead you closer to understanding the underlying issue. Sometimes, you might need to go beyond five questions to get to the real cause, or you might find the root cause in fewer steps. But, traditionally, five “whys” are used.
- Repeat the Process: Continue asking “Why?” for each answer until you’ve answered enough questions to reach the root cause – the very reason the problem started in the first place.
- Identify and Resolve the Problem at its Source: Once you get to the root cause, you can create a solution that fixes the problem from the ground up. This stops the issue from happening again.
Here is a simple example of a car.
Problem: The car won’t start.
- Why? → The battery is dead.
- Why is the battery dead? → The alternator isn’t working.
- Why isn’t the alternator working? → The alternator belt is broken.
- Why is the alternator belt broken? → The belt was old and hadn’t been replaced.
- Why hadn’t the belt been replaced? → The car owner didn’t do regular maintenance.
Now, by asking these five “whys,” we find that the root cause of the car not starting is a lack of regular maintenance, which led to an old alternator belt breaking. This root cause can now be addressed by encouraging regular car maintenance to prevent future issues.
Fishbone Diagram (Ishikawa)
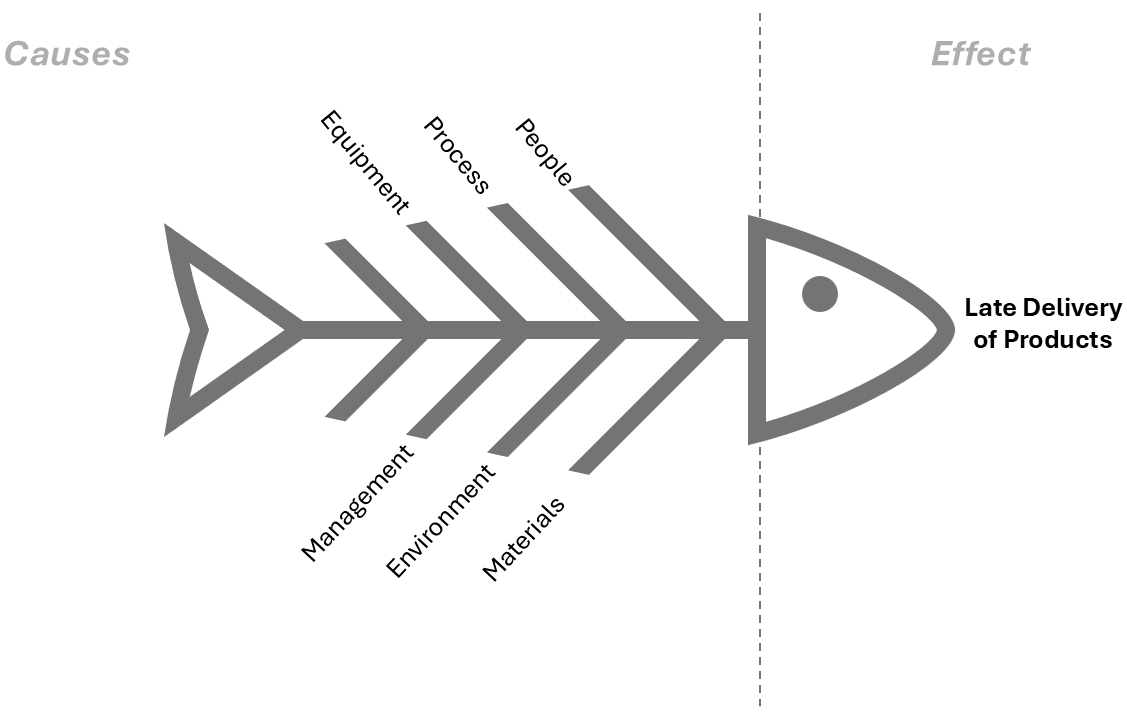
The Fishbone Diagram, also known as an Ishikawa Diagram (named after its creator, Kaoru Ishikawa), is a tool used to identify the possible causes of a problem and organize them in a visual way. It helps you figure out why something went wrong by mapping out different categories of potential causes. The diagram looks like a fish skeleton.
The Fishbone Diagram is created by drawing a large arrow pointing to the “head,” which is the problem or effect you want to analyze. From this arrow, you draw lines (like fishbones) branching off, each representing a category of potential causes for the problem. Then, you brainstorm possible causes for the problem under each category and list them as smaller branches of the main “bones.”
Here’s a breakdown of the steps.
- Identify the Problem: Start by clearly defining the problem you are facing. This will be written in the “head” of the fishbone (the right side of the diagram). The problem could be anything from a software bug to a production delay or a quality issue.
- Identify Major Categories: Draw lines coming off the main arrow, each representing a major category of causes. Common categories used in a Fishbone Diagram are:
- People: Issues related to human factors, such as lack of training, miscommunication, or absence of skilled workers.
- Processes: Problems in how things are done, such as inefficient procedures, poorly designed workflows, or outdated methods.
- Equipment: Issues related to tools, machines, or technology that might be malfunctioning or inadequate.
- Materials: Problems with the raw materials, resources, or components being used in a process.
- Environment: External factors that may be influencing the problem, like weather, regulations, or physical workspace conditions.
- Management: Leadership-related issues like poor planning, lack of oversight, or failure to allocate resources properly.
-
Brainstorm Causes: Once you’ve defined the categories, start brainstorming potential causes for the problem. Ask yourself, “What could have led to this problem in each category?” For example:
- Under People, it could be “inexperienced staff” or “miscommunication between teams.”
- Under Processes, it might be “outdated procedures” or “inefficient steps.”
- Under Equipment, it could be “malfunctioning hardware” or “lack of proper tools.”
You can add smaller branches (sub-causes) under each category to dig deeper into the issue. - Analyze the Diagram: You’ll have a visual map showing all the possible causes after the above brainstorming session. You can now analyze which ones are most likely to be the root cause and need further investigation or corrective action.
- Take Action: Use your analysis to focus on addressing the most critical or likely causes contributing to the problem rather than just treating symptoms. This allows you to solve the root cause, not just the surface issue.
Let’s take a look at an example.
Let’s say the problem is “Late Delivery of Products”. Here’s how you might use a Fishbone Diagram to explore possible causes:
- People:
- Lack of communication between teams
- Understaffed warehouse
- Processes:
- Inefficient order processing
- Poor coordination between sales and delivery teams
- Equipment:
- Malfunctioning packaging machines
- Outdated inventory tracking system
- Materials:
- Supplier delays
- Low-quality packaging materials
- Environment:
- Bad weather affecting transport
- Regulatory changes causing delays
- Management:
- Poor scheduling
- Lack of oversight on delivery timelines
By examining each of these potential causes, you might discover that the real issue is poor coordination between sales and delivery teams, which leads to late shipments. Once you know this, you can address the specific cause (e.g., improve communication or create a clearer process) to prevent future delays.
Failure Mode and Effects Analysis (FMEA)
Failure Mode and Effects Analysis (FMEA) is a methodical approach used to identify and evaluate potential failures in a process, product, or system. In simple terms, FMEA is like making a plan to avoid problems by thinking ahead about what could go wrong and how to prevent it.
FMEA is typically done in a step-by-step process, and it involves the following key steps:
-
Identify the Process or System: The first step is to define the system, process, or product that you want to analyze. This could be a new product design, a manufacturing process, a software feature, or any other system that could fail.Example: Imagine you’re developing a new coffee maker. The process could involve designing, manufacturing, and testing the coffee maker.
-
Identify Potential Failure Modes: A “failure mode” is how something could potentially fail. In this step, you think about all the possible ways the system, product, or process could break down or not work as expected. You ask questions like: “What can go wrong?” or “How could this component fail?”Example: For the coffee maker, potential failure modes might include:
- The coffee maker doesn’t heat up properly.
- The water leaks during brewing.
- The buttons on the coffee maker stop working.
-
Identify the Effects of Each Failure Mode: For each potential failure mode, you need to identify what the effect or consequence of the failure would be. What happens if that failure occurs? Would it stop the product from working, create a safety hazard, or just cause inconvenience?Example:
- If the coffee maker doesn’t heat up properly, the effect would be that the coffee is not brewed, and users are unable to make coffee.
- If the water leaks, it could cause a mess and potentially damage the surrounding area or electrical components.
- If the buttons stop working, it could prevent users from operating the coffee maker properly.
-
Assess the Severity: This step involves evaluating how severe the consequences are for each failure mode. The severity is typically ranked on a scale (usually from 1 to 10), where 1 is a minor issue (not significant), and 10 is a catastrophic failure (very serious).Example:
- If the coffee maker doesn’t heat up properly, the severity might be rated 10 because the product can’t be used at all.
- If there’s a water leak, the severity could be rated six because it causes a mess, but it doesn’t completely stop the coffee maker from working.
- If the buttons stop working, the severity might be rated seven because the coffee maker might still brew coffee, but the user can’t control it easily.
-
Evaluate the Likelihood of Occurrence: Next, you assess how likely each failure mode is to happen. This is usually ranked on a scale (from 1 to 10), where 1 means it’s very unlikely to happen and 10 means it’s almost certain to happen.Example:
- The likelihood of the coffee maker not heating up properly might be rated 4 because it could happen due to manufacturing defects or poor design.
- The likelihood of a water leak could be rated 3 if the product has good seals and quality control.
- The likelihood of buttons malfunctioning might be rated 2 if the buttons are well-designed and tested.
-
Assess the Ability to Detect the Failure: This step involves determining how easy it is to detect the failure before it reaches the customer. If you can detect the failure early, it’s less risky. Detection is usually rated from 1 (easy to detect) to 10 (very difficult to detect).Example:
- If the coffee maker doesn’t heat up properly, you might detect it early during product testing, so the detection rating could be 3.
- If there’s a water leak, it might be harder to catch during testing, so the detection rating could be 7.
- If the buttons stop working, you might catch that in initial quality checks so that the detection rating might be 4.
-
Calculate the Risk Priority Number (RPN): To prioritize which failure modes to fix first, FMEA uses a formula called the Risk Priority Number (RPN), which is calculated by multiplying the scores for Severity, Likelihood, and Detection. The RPN helps you figure out which problems need the most attention. The higher the RPN, the higher the priority for addressing that failure mode.The water leak has the highest RPN, so it should be addressed first.
-
Take Corrective Actions: Based on the RPN, you now focus on fixing the most critical issues first. You can take corrective actions to either:
- Reduce the severity (e.g., improve the design to prevent damage).
- Reduce the likelihood (e.g., improve quality control or testing procedures).
- Improve detection (e.g., add more checkpoints or testing to catch issues early).
For example, to address the water leak in the coffee maker, you could improve the seal design, perform more rigorous testing, or change suppliers for higher-quality materials.
Pareto Analysis
Pareto Analysis is a decision-making tool based on the80/20 Rule. It states that 80% of the effects come from 20% of the causes. In other words, a small number of causes (about 20%) are often responsible for the majority of problems (around 80%). The goal of Pareto Analysis is to identify these critical causes so you can focus your efforts on the most important issues rather than trying to fix everything at once.
Think of it like a messy room. If you clean up just a few areas that are the messiest (20%), you’ll see a huge improvement in how tidy the room looks (80%).
Here’s a step-by-step guide to show how this works.
-
Identify the Problem: The first step is to clearly define the problem you’re trying to solve. This could be anything from customer complaints, production delays, quality issues, or software bugs.Example: Suppose you run a customer service team, and you’ve received a lot of complaints. You need to figure out which issues to focus on first.
-
List All the Causes: Next, list all the possible causes or reasons for the problem. These are the different factors that might be contributing to the issue. You can gather this information from data, feedback, brainstorming, or observations.Example: For customer service complaints, you might list the following causes:
- Long wait times on the phone.
- Lack of product knowledge from staff.
- Poor communication skills.
- Website navigation issues.
- Delayed shipping.
-
Categorize the Causes: Group similar causes together to simplify your analysis. This step helps in organizing the issues so they’re easier to handle.Example: You might group the issues as:
- Customer support issues: Long wait times, lack of product knowledge, poor communication.
- Product or service issues: Website navigation issues, delayed shipping.
-
Quantify Each Cause: Assign a measurable value to each cause. This could be the frequency of complaints, the cost of the issue, or the impact of each cause on the overall problem. The idea is to figure out how big each issue is.Example:
- Long wait times: 50 complaints
- Lack of product knowledge: 30 complaints
- Poor communication skills: 20 complaints
- Website navigation issues: 40 complaints
- Delayed shipping: 10 complaints
-
Sort Causes by Impact: Rank the causes from the most significant to the least significant based on the frequency, cost, or impact they have. This helps you identify the small number of causes that are having the biggest effect.Example (Sorted by number of complaints):
- Long wait times – 50 complaints
- Website navigation issues – 40 complaints
- Lack of product knowledge – 30 complaints
- Poor communication skills – 20 complaints
- Delayed shipping – 10 complaints
-
Create a Pareto Chart: A Pareto Chart is a bar graph where you plot the causes in order from the most significant to the least significant, and you show the cumulative impact. The bars will typically show the number of complaints (or another measure) for each cause, and a line will indicate the cumulative percentage of the total problems. This helps you visually see which causes are contributing the most.Example: You might create a chart where:
- The first bar (for “Long wait times”) is the highest, showing it’s the biggest problem.
- The second bar (“Website navigation issues”) is next but smaller, indicating it’s less significant.
-
Focus on the Key Issues: Once you’ve identified the top causes (the “20%”), focus your efforts on resolving these first. The idea is that by addressing the most significant problems, you’ll see the biggest improvement in overall outcomes.Example: In this case, addressing “long wait times” and “website navigation issues” will likely solve most of the customer complaints. After that, you can focus on the next most significant issues, like improving product knowledge and communication skills.
Fault Tree Analysis (FTA)
It’s a way of breaking down complex problems by working backward from the failure (the “top event”) to the possible causes. This helps you understand the root causes and the relationships between them. You can think of it as drawing a map of “what could go wrong” to figure out how all the pieces fit together.
FTA uses a diagram called a fault tree to visually represent the failure and its potential causes. The fault tree starts with the top event (the failure) at the top and branches down to identify the underlying causes. The diagram uses logical gates (AND, OR) to show how different events or failures can combine to lead to the main problem.
Here’s how to do it step-by-step:
- Define the Top Event (The Problem): The first step is to clearly define the problem you are analyzing. This is the top event in the fault tree. The top event is typically the failure or malfunction you want to avoid. It might be a system breakdown, a product failure, or a safety incident.
-
Identify the Immediate Causes (First-Level Events): The next step is to figure out what might directly lead to the top event. These are the first-level events that could cause the top event to occur. You ask, “What are the immediate causes of this failure?”Example: In the case of a server crash, the immediate causes might be:
- Power failure.
- Hardware malfunction.
- Software bug.
-
Break Down the Causes Further (Second-Level Events): For each first-level event, you need to dig deeper to identify secondary causes – the underlying reasons why these immediate causes might happen. These are the second-level events that contribute to the failure.Example:
- For the “Power failure” event, secondary causes might include:
- Power supply failure.
- Electrical grid outage.
- For “Hardware malfunction,” secondary causes could include:
- Hard drive failure.
- Memory failure.
- For “Software bugs,” secondary causes might include:
- Coding error.
- Poorly designed software update.
- For the “Power failure” event, secondary causes might include:
-
Use Logical Gates to Connect Causes: In Fault Tree Analysis, you use logical gates (AND and OR gates) to connect the causes and show how they interact:
- OR Gate: If one of several causes could lead to the failure, use an OR gate. This means that if any one of the events occurs, failure will occur.
- AND Gate: If multiple causes must occur together to lead to the failure, use an AND gate. It means that all the events must happen for the failure to occur.
- Continue Breaking Down Events (Further Levels): Continue breaking down the causes into smaller and smaller events (third-level, fourth-level, etc.) until you reach the basic events – the root causes that are simple and can’t be further broken down. These are typically individual failures or problems that you can act upon.
-
Analyze the Fault Tree: Once you have the complete fault tree with all the causes and connections, you can analyze it to understand the most likely causes of the failure. You can look at which events have the highest probability of occurring and which combinations of events are most likely to cause the failure.
- You can calculate the probability of the top event occurring by working backward through the tree and considering the likelihood of each event.
- You can also use the fault tree to identify weaknesses in the system and areas where you might need to make improvements to reduce the risk of failure.
Root Cause Analysis Tools
You can make use of different tools to accomplish RCA. You can even find software that supports RCA techniques like:
- Minitab: A software tool used for statistical analysis. It’s often used to create Pareto charts, control charts, and conduct various statistical analyses that help uncover root causes in complex data.
- Microsoft Visio: A diagramming tool that can be used to create Fishbone Diagrams (Ishikawa diagrams) and flowcharts to visualize causes and relationships in a structured manner.
- Excel: A versatile tool used to create Pareto Charts, scatter diagrams, and control charts. Excel can also handle data collection and analysis for RCA and is commonly used for creating custom RCA reports.
- TapRooT: Specialized software like TapRooT helps you systematically conduct Root Cause Analysis. These tools often come with templates, checklists, and support for various RCA methods like 5 Whys and Fishbone Diagrams.
- FaultTree+: Tools like FaultTree+ allow you to create fault trees and perform detailed analyses of potential failures in systems, processes, or products.
- Lucidchart: A cloud-based diagramming tool for creating Fishbone Diagrams, flowcharts, and other RCA-related visualizations. It’s especially useful for team collaboration when working on RCA.
- QlikView / Tableau: Data visualization tools like QlikView and Tableau can be used for RCA by analyzing large sets of data, spotting trends, and helping identify patterns that lead to root causes.
- SonarQube: It helps identify the root cause of performance issues or bugs in the code. By analyzing the codebase, it can show which code sections or patterns are leading to frequent errors or system failures.
There are many other tools available in the market. Apart from these, if you opt for the manual approach, then you can use brainstorming sessions, video recordings, and interviews. Many popular issue management tools (like JIRA), CRM systems (like Zendesk), and ERP systems (like ServiceNow) provide RCA plugins to help you dig deep into issues.
Final Note
You’ll find investing in Root Cause Analysis (RCA) to be like fixing the root of a tree instead of just trimming the branches. If you only deal with the symptoms of a problem, the same issue will keep popping up. But if you figure out the real cause and fix that, the problem goes away for good.
| Achieve More Than 90% Test Automation | |
| Step by Step Walkthroughs and Help | |
| 14 Day Free Trial, Cancel Anytime |