What is Cost of Poor Quality (COPQ)?
|
|
Quality doesn’t have a cost until it does, and that cost is frequently much higher than what businesses anticipate. Quality is subtly present in every business operation, engineering procedure, testing procedure, and customer interaction. When quality is successful, it is not visible. However, when quality is compromised, the effects are felt by the entire organization, not just a select few. Businesses refer to this echo as the Cost of Poor Quality (COPQ).
On the surface, the idea seems straightforward: low quality results in losses. However, COPQ goes much deeper, being linked to engineering discipline, product development strategy, customer loyalty, reputation, operational efficiency, long-term sustainability, and organizational culture. It is a business issue rather than a “QA problem.” Each department plays a part in it, either favorably by raising quality or unfavorably by letting inefficiencies increase.
| Key Takeaways: |
|---|
|
Why COPQ Matters in the Modern Business Landscape
Digitalization, cloud architectures, AI-driven operations, global teams, and higher customer expectations have all made modern systems much more complicated in the last decade. In this environment, even a small bug can quickly become a big problem because of the huge user bases, deep integrations, continuous delivery, multi-device experiences, empowered customers, and strict compliance requirements.
As quality becomes a key factor that sets businesses apart, COPQ has become the best way to see how bad quality really affects a business’s bottom line. Now, executives care less about whether quality is “good” and more about how much poor quality is costing them right now and how much money they could save in the future by making better quality investments.
Defining Cost of Poor Quality (COPQ)
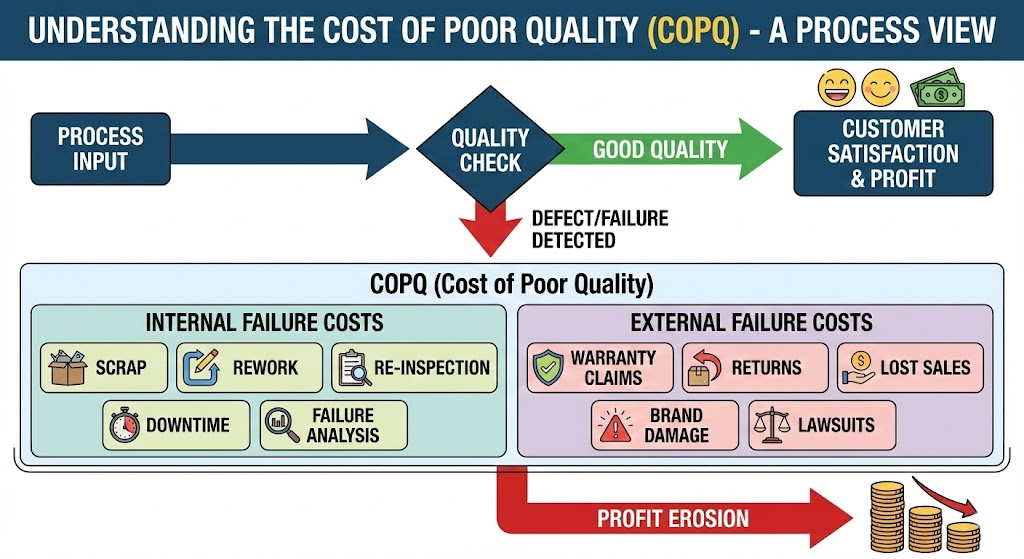
Cost of Poor Quality (COPQ) is the aggregate financial loss your business incurs whenever its output falls short of customer expectations. Some of those losses can be internal, occurring either before you even release your product or service, and some are external after they have been exposed to it by the end user. Also, they can take on different forms (either as an obvious failure that is easily noticeable, measurable, or hidden somewhere in day-to-day operations). It is the cumulative effect of defects, rework, delays, failed processes, extra material usage due to inefficiency, and its associated costs, such as poor testing, poorly designed or implemented products or services, and incorrectly implemented process flows, which negatively impact the business.
- Internal Failure Costs
- External Failure Costs
- Appraisal Costs
- Prevention Costs
Read more about Quality Assurance vs. Quality Control: Know The Difference
Although appraisal and prevention are included in the larger Cost of Quality (COQ), they are still crucial to COPQ analysis since it is impossible to quantify losses without knowing how much the business spends to prevent them. The fundamental essence of COPQ ultimately resides in failures, both internal and external, which are the most obvious and immediate results of quality failures.
To comprehend COPQ, it is essential to delineate the difference between Cost of Quality (COQ) and Cost of Poor Quality (COPQ), two frequently conflated yet fundamentally distinct terms.
-
Cost of Quality (COQ): Cost of Quality (COQ) is the total cost of making sure quality, including money spent on prevention and evaluation.
COQ = Prevention Costs + Appraisal Costs + Internal Failure Costs + External Failure Costs
-
Cost of Poor Quality (COPQ): Represents only the negative aspects of COQ, which includes the money that failures cost.
COPQ = Internal Failure Costs + External Failure Costs
In this way, COPQ is the part of COQ that businesses want to keep as low as possible by doing more prevention and evaluation work. When companies don’t spend money on prevention and don’t build strong quality frameworks, their COPQ goes through the roof. People who invest ahead of time see COPQ drop by a lot. This relationship creates an important truth:
High prevention cost = Low COPQ || Low prevention cost = High COPQ
This simple equation is the backbone of quality economics.
Categories of Cost of Poor Quality – The Four Pillars of COPQ
Organizations break down COPQ into four main parts to identify where revenue is lost and where improvement efforts should be focused. This helps them understand the real financial effects of poor quality. These pillars give a clear picture of how failures, detection efforts, and preventive measures all work together to affect the total cost of quality.
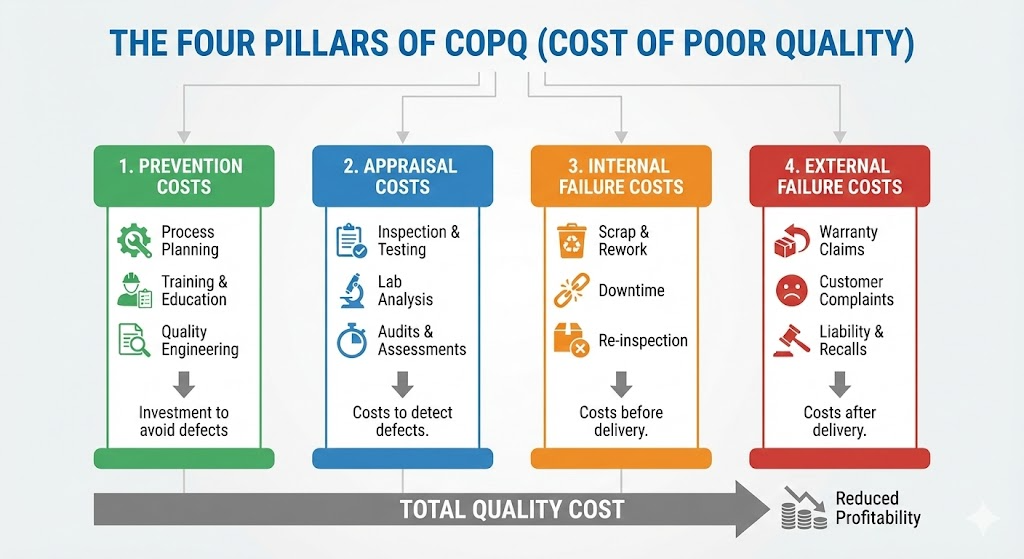
Internal Failure Costs
Internal failure costs are related to the price associated with goods that meet relevant specifications, but are not produced correctly. Rework, scrap, failed test cases, broken builds, or having to debug the same thing multiple times in development would be some examples. For example, discovering a major integration bug in QA that needs to be fixed by all developers is an expensive affair for the company. While these issues don’t make consumers aware of them, they tie up time, effort, and money.
External Failure Costs
These are external failure costs, which occur when defects escape into production and are detected by customers. These are far worse because they lead to returns, refunds, support tickets, bad reviews, SLA violations, and even fines from the government. A missed bug that knocks a banking app offline, for example, might bring on user complaints, compensation payments, and damage to the company’s reputation. Failures growing attributes are frequently the most expensive source of COPQ.
Appraisal Costs
Appraisal costs are the funds invested in discovering issues before they get to customers. Testing, code reviews, inspections, audits, verification processes, and monitoring systems are all part of these. Running automated regression suites or doing manual exploratory testing are both examples of appraisal activities. These costs are planned and preventative because they help find problems early.
Prevention Costs
Companies make proactive investments to avoid defects from happening at all, which is what prevention costs are. This includes training teams, making processes better, writing better requirements, improving designs, and using automation or CI/CD methods. For instance, using a strong test automation framework like testRigor or holding quality workshops makes it less likely that defects will happen in the future. Costs for prevention often save a lot more money than they cost by lowering the overall cost of failures.
Read more about What is the Cost of Quality in Software Testing?
The Hidden Costs Inside COPQ
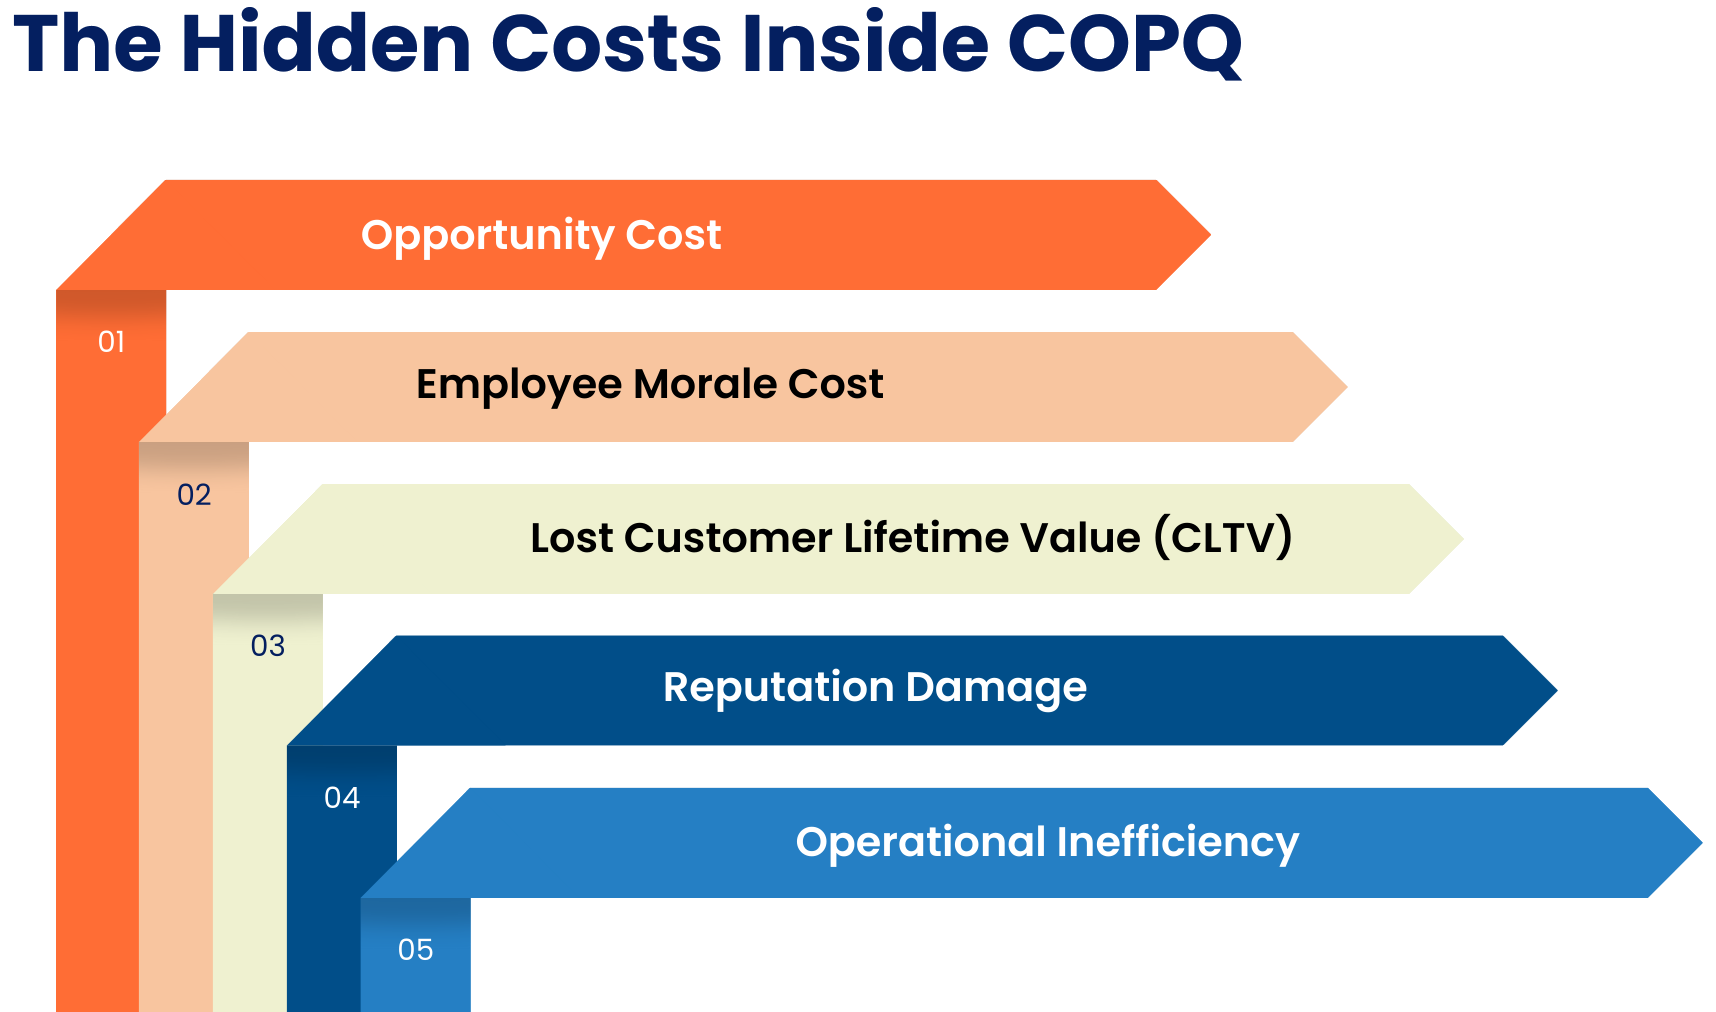
- Opportunity Cost: When engineers spend time fixing bugs, they divert important time away from coming up with new ideas, adding new features, and making products better. This delay leads to missed chances in the market, slower sales growth, and a smaller edge over competitors.
- Employee Morale Cost: Teams have to deal with overtime, changing priorities, and workloads that are hard to predict, which causes stress, burnout, and frustration. This leads to attrition over time, which can cost $50,000 to $200,000 per engineer when you factor in hiring, onboarding, and ramping up.
- Lost Customer Lifetime Value (CLTV): A single bad experience can make it less likely that a customer will renew, upgrade, or recommend the product. When you multiply this long-term loss of revenue by the number of customers, it becomes one of the worst types of COPQ.
- Reputation Damage: In today’s world, where everything is connected, unhappy customers can quickly spread bad reviews on social media, which hurts the brand’s reputation. It’s hard to measure the long-term damage to how people see the market, but it’s very costly to fix.
- Operational Inefficiency: Defects cause unnecessary delays, emergency meetings, and complicated coordination efforts that get in the way of normal work. The longer it takes to find a defect, the more departments it affects, which makes things run less smoothly and costs more to run.
Read more about How to Save Budget on QA
COPQ Formulae – The Mathematical Foundation of COPQ
To understand COPQ, you need both clear numbers and structured formulas that show how bad quality really affects your finances. Using standard calculation models, these methods help businesses figure out how much waste, rework, lost revenue, and long-term damage they have.
Basic COPQ Formula
COPQ stands for the money lost because of failures. It is calculated by adding up the costs of internal and external failures.
Formula: COPQ = Internal Failure Costs + External Failure Costs
This is a simple, big-picture estimate of how many defects are costing the company.
Internal Failure Costs include:
- Rework hours x hourly cost: This represents the expense incurred when engineering teams must redo work due to defects.
- Retesting hours x hourly cost: This captures the cost of repeated testing cycles required after fixes are applied.
- Production delays x cost impact: This reflects the financial loss caused by slowed or halted production resulting from defects.
- Failed builds x build cost: This measures the wasted resources and tooling costs associated with unsuccessful build attempts.
- Scrap and waste: This accounts for materials, components, or outputs that must be discarded due to poor quality.
External Failure Costs include:
- Customer support time x cost: This includes the labor and operational cost of handling defect-related support tickets.
- Churn x lost CLTV: This captures the long-term revenue loss when customers leave because of poor product quality.
- Refunds + credits: This reflects direct financial compensation provided to customers affected by defects.
- Legal penalties: This covers fines and legal fees resulting from regulatory violations or contractual breaches caused by defects.
- Emergency incident costs: This includes unplanned expenses during urgent crisis response efforts, such as hotfixes or escalations.
- Downtime x cost per hour: This calculates the revenue loss and operational disruption caused by system outages or degraded performance.
- Brand damage (estimated): This reflects the projected long-term cost of reduced trust, negative perception, and reputational harm.
Example of COPQ
For example, let’s consider a bug that has been discovered late after production release:
- Developer rework: 8 hours x $70/hr = $560
- QA retesting: 3 hours x $50/hr = $150
- Customer support: 4 tickets x $25 = $100
- Hotfix release cost: $1,200
- Downtime revenue loss: $8,000
- Lost customer (CLTV): $1,500
- Total COPQ = $11,510
Read more about Understanding the Total Cost of Ownership(TCO) of Test Automation
How to Identify COPQ in Your Organization
You can find out the Cost of Poor Quality (COPQ) by keeping an eye on patterns and metrics across engineering, customer support, and operational workflows in a planned way. It’s easier to identify hidden losses that quietly impact productivity and revenue when you employ a structured approach.
- Track Rework Levels: Keep an eye on how many bugs are found in each sprint and how much time engineers spend fixing problems instead of adding new features. A high percentage of rework is a clear sign of a high COPQ.
- Track Defect Leakage Rate: To see how unaddressed issues move through the system, count how many defects go from DEV to QA, QA to UAT, and UAT to Production. Every defect that gets away adds to COPQ because it costs more to fix later.
- Track Customer Support Trends: A sudden rise in support tickets related to defects means that quality problems are getting to customers. This spike leads to higher COPQ because of both supporting labor and unhappy customers.
- Track Downtime and Incidents: Record every outage or incident and calculate the associated cost by multiplying the downtime cost by the incident’s impact. These events are often some of the biggest and most obvious parts of COPQ.
- Track Employee Attrition: A lot of turnover among engineers or QA teams is often linked to ongoing quality problems and stressful rework cycles. When quality goes down, morale goes down, and attrition makes COPQ go up a lot because of the costs of hiring and training new employees.
Strategies to Reduce COPQ
To lower COPQ, you need to get rid of the things that cause quality problems before they lead to rework, outages, or failures that affect customers. Companies can save a lot of money in the long run by improving prevention, automation, and engineering discipline.
- Shift Left Testing: Teams can find bugs long before they become expensive by using unit tests, code reviews, API testing, early QA involvement, and automation early in the development cycle. Read: Shift Left Testing – Software Testing Done Early
- Shift Right Testing: Observability, canary deployments, real-time alerting, and chaos testing are all proactive production practices that help teams find problems before they get worse. These methods stop outages and lower the part of COPQ that is caused by incidents. Read: Shift-Right Testing: What, How, Types, and Tools
- Test Automation with AI: One of the best ways to cut down on COPQ is to use AI-driven test automation, which cuts down on rework, defect leakage, and regression time. Read: When to Use AI in Test Automation: Insights from QA Experts
- Root Cause Analysis (RCA): Fixing the root problems in the system, not just the symptoms, stops defects from happening again and saves money in the long run. Read: Root Cause Analysis Explained
- Strengthen DevOps & CI/CD: Stable pipelines and reliable deployments cut down on build failures, release errors, and COPQ that happen because of incidents. Read: DevOps vs. CI/CD
Organizational Resistance to COPQ Initiatives
Many businesses have trouble using COPQ measurement, even though it makes things clearer and saves money in the long run. Cultural barriers often make people more resistant to the technical changes that need to be made to improve quality.
- Fear of Accountability: Teams are afraid that COPQ metrics will show mistakes or make their jobs less secure.
- Insecurity Around Transparency: Some employees are afraid that being able to see more quality issues may be used against them.
- Misconception That Quality Slows Them Down: A lot of people think that quality practices make releases take longer, even though they cut down on rework and COPQ.
- Lack of Training: Teams don’t want to do things they don’t understand, especially when COPQ ideas seem new or hard to understand.
- Blame Culture: People don’t want to take part in measurement and improvement efforts when they think they’ll be blamed.
- Competing Priorities: COPQ projects lose traction when teams are under a lot of pressure from deadlines and features.
Conclusion
The Cost of Poor Quality is more than just a technical measure; it includes the money, time, and reputation damage because of mistakes that could have been avoided. Companies that track and fix COPQ get a better picture of where things are going wrong, boost team performance, and make products that are more reliable. In today’s competitive market, lowering COPQ is important for keeping customers happy, protecting revenue, and making sure the business stays successful in the long run.
| Achieve More Than 90% Test Automation | |
| Step by Step Walkthroughs and Help | |
| 14 Day Free Trial, Cancel Anytime |